
Press Releases
Private housing market shows signs of moderation, with slowdown in price and rental momentum in 2nd Quarter 2023
28 July 2023
This article has been migrated from an earlier version of the site and may display formatting inconsistencies.
• Overall private housing prices saw a slight decline in 2nd Quarter 2023 for the first time since 1st Quarter 2020. This is due to a decline in prices for non-landed properties and a significant moderation in the price increase for landed properties, from the previous quarter.
• Private residential property rentals rose at a significantly slower pace of 2.8% quarter-on-quarter in 2nd Quarter 2023, compared to the 7.2% increase in the previous quarter. This was the smallest quarter-on-quarter gain since 4th Quarter 2021.
• Private housing supply completions in 1st half of 2023 more than doubled, compared to the same period in 2022. For the whole of 2023, about 20,500 private residential units are expected to be completed. This would be the highest annual private housing supply completion since 2017.
• Supply of private housing via the Government Land Sales Programme has been ramped up for the third consecutive year, with the total Confirmed List supply of around 9,250 units for 2023 the highest in a decade.
The Urban Redevelopment Authority (URA) released today the real estate statistics for 2nd Quarter 2023.
PRIVATE RESIDENTIAL PROPERTIES
Private residential market at a glance:
Prices and Rentals
Prices of private residential properties declined by 0.2% in 2nd Quarter 2023 following a 3.3% gain in the previous quarter.
Property Price Index of private residential properties
Prices of landed properties increased by 1.1% in 2nd Quarter 2023, a significant moderation from the 5.9% increase in the previous quarter. Prices of non-landed properties decreased by 0.6% in 2nd Quarter 2023, a reversal from the 2.6% increase in the previous quarter.
Prices of non-landed properties in Core Central Region (CCR) declined by 0.1% in 2nd Quarter 2023, compared with the 0.8% increase in the previous quarter. Prices of non-landed properties in Rest of Central Region (RCR) declined by 2.5% in 2nd Quarter 2023, following the 4.4% increase in the previous quarter. The increase in prices of non-landed properties in Outside Central Region (OCR) moderated to 1.2% in 2nd Quarter 2023, compared with the 1.9% increase in the previous quarter (see Annexes A-1 [PDF, 7 KB], A-2 [PDF, 9 KB] & A-6 [PDF, 16 KB]1).
Rentals of private residential properties increased by 2.8% in 2nd Quarter 2023, significantly lower than the 7.2% increase in the previous quarter.
Rental Index of private residential properties
The increase in the rentals of non-landed properties slowed to 2.3%, from the 6.2% increase in the previous quarter. Rentals of landed properties increased by 6.7% in 2nd Quarter 2023, a significant moderation from the 14.5% increase in the previous quarter.
Rental momentum eased across all market segments. Rentals of non-landed properties in CCR saw an increase of 2.0% in 2nd Quarter 2023, compared with the 6.4% increase in the previous quarter. Similarly, rentals in RCR increased by 2.0%, compared with the 6.2% increase in the previous quarter. Rentals in OCR increased by 2.9%, compared with the 6.1% increase in the previous quarter (see Annexes A-3 [PDF, 8 KB] & A-4 [PDF, 10 KB]).
Launches and Take-up
Developers launched 2,374 uncompleted prviate residential units (excluding ECs) for sale in 2nd Quarter 2023, compared with the 1,312 units in the previous quarter (see Annex C-1 [PDF, 10 KB]).
Developers sold 2,127 private residential units (excluding ECs) in 2nd Quarter 2023, compared with the 1,256 units sold in the previous quarter (see Annex D [PDF, 76 KB]).
Number of private housing units launched and sold by developers (excluding ECs)
Developers did not launch any EC units for sale in 2nd Quarter 2023 and sold 57 EC units in the quarter (see Annex F [PDF, 69 KB] ). In comparison, developers did not launch any EC units for sale and sold 206 EC units in the previous quarter.
Resales and Sub-sales
There were 2,976 resale transactions in 2nd Quarter 2023, compared with the 2,622 units transacted in the previous quarter. Resale transactions accounted for 55.2% of all sale transactions in 2nd Quarter 2023, compared with 63.6% in the previous quarter (see Annex D [PDF, 76 KB]).
There were 285 sub-sale transactions in 2nd Quarter 2023 compared with the 243 units transacted in the previous quarter. Sub-sales accounted for 5.3% of all sale transactions in 2nd Quarter 2023 compared with 5.9% in the previous quarter (see Annex D [PDF, 76 KB]).
Number of resale and sub-sale transactions for private residential units (excluding ECs)
Supply Completions
A total of 4,401 private residential units (including ECs) were completed in 2nd Quarter 2023, more than the 3,785 units completed in the preceding quarter. The number of units completed in 2nd Quarter 2023 was about 83% more than the average of around 2,400 units completed per quarter in 2022. Projects completed in the quarter include Riverfront Residences (1,472 units), Affinity At Serangoon (1,052 units) and The Woodleigh Residences (667 units) (see Annexes E-4 [PDF, 8 KB] & E-5 [PDF, 33 KB]).
Supply in the Pipeline
As at the end of 2nd Quarter 2023, there was a total supply of 44,157 uncompleted private residential units (excluding ECs) in the pipeline with planning approvals, of which 17,484 units remained unsold (see Annexes E-1 [PDF, 59 KB], E-2 [PDF, 67 KB] 2, B-1 [PDF, 7 KB] & B-2 [PDF, 10 KB]). After adding the supply of 5,398 EC units in the pipeline, there were 49,555 units (including ECs) in the pipeline with planning approvals, of which 18,726 units remained unsold (see Annex E-3 [PDF, 29 KB]).
Total number of unsold private residential units and ECs in the pipeline
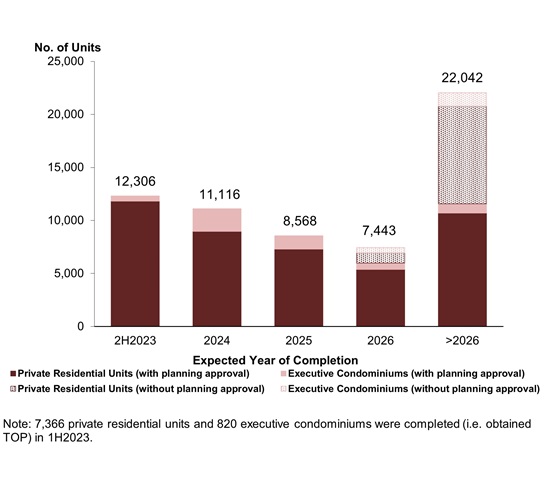
Based on the expected completion dates reported by developers, 12,306 units (including ECs) will be completed in 2nd half of 2023. In total, around 40,200 units (including ECs) are expected to be completed between 2023 and 20253. This forms part of the total supply of close to 100,000 public and private housing units to be completed between 2023 and 2025, which will help to cater to housing needs in the immediate few years ahead.
Pipeline supply of private residential units and ECs by expected year of completion
Adding the supply of unsold units (including ECs) in the supply pipeline with planning approval, and those that have not been granted planning approval yet, around 30,700 units (including ECs) could be made available for sale later this year or next year. This includes the supply of about 9,250 private housing units on the Confirmed List of the GLS Programme in 2023, which is the highest in a decade. The Government will continue to calibrate housing supply to cater to demand, so as to promote a stable and sustainable property market.
Stock and Vacancy
The stock of completed private residential units (excluding ECs) increased by 4,227 units in 2nd Quarter 2023, compared with the increase of 2,864 units in the previous quarter. The stock of occupied private residential units (excluding ECs) increased by 2,799 units in 2nd Quarter 2023, compared with the increase of 887 units in the previous quarter. As a result, the vacancy rate of completed private residential units (excluding ECs) increased to 6.3% as at end of 2nd Quarter 2023, from 6.0% in the previous quarter (see Annex E-1 [PDF, 59 KB]).
Stock and vacancy of private residential units (excluding ECs)
Vacancy rates of completed private residential properties as at the end of 2nd Quarter 2023 in CCR, RCR and OCR were 7.9%, 7.9% and 4.6% respectively, compared with the 7.7%, 9.2% and 3.3% in the previous quarter (see Annex E-6 [PDF, 9 KB]).
OFFICE SPACE
Office market at a glance:
Prices and Rentals
Prices of office space increased by 1.0% in 2nd Quarter 2023, after remaining unchanged in the previous quarter (see Annex A-1 [PDF, 7 KB]). Rentals of office space increased by 2.3% in 2nd Quarter 2023, compared with the 5.1% increase in the previous quarter (see Annexes A-3 [PDF, 8 KB] & A-5 [PDF, 73 KB]).
Property Price Index of office space in Central Region
Rental Index of office space in Central Region
Supply in the Pipeline
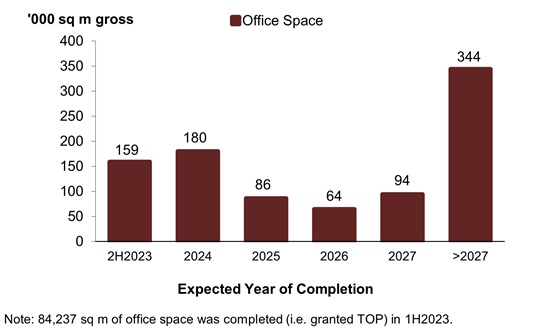
As at the end of 2nd Quarter 2023, there was a total supply of about 927,000 sq m GFA of office space in the pipeline, compared with the 837,000 sq m GFA of office space in the pipeline in the previous quarter (see Annexes E-1 [PDF, 59 KB] & E-2 [PDF, 67 KB]).
Pipeline supply of office space
Stock and Vacancy
The amount of occupied office space increased by 30,000 sq m (nett) in 2nd Quarter 2023, compared with the increase of 21,000 sq m (nett) in the previous quarter. The stock of office space decreased by 7,000 sq m (nett) in 2nd Quarter 2023, compared with the increase of 14,000 sq m (nett) in the previous quarter. As a result, the island-wide vacancy rate of office space decreased to 10.8% as at end of 2nd Quarter 2023, from 11.2% as at end of the previous quarter (see Annexes A-5 [PDF, 73 KB] & E-1 [PDF, 59 KB]).
Stock and vacancy of office space
RETAIL SPACE
Retail market at a glance:
Prices and Rentals
Prices of retail space increased by 0.3% in 2nd Quarter 2023, compared with the 0.9% decrease in the previous quarter (see Annex A-1 [PDF, 7 KB]). Rentals of retail space increased by 0.3% in 2nd Quarter 2023, compared with the 0.3% decrease in the previous quarter (see Annexes A-3 [PDF, 8 KB] & A-5 [PDF, 73 KB]).
Property Price Index of retail space in Central Region
Rental Index of retail space in Central Region
Supply in the Pipeline
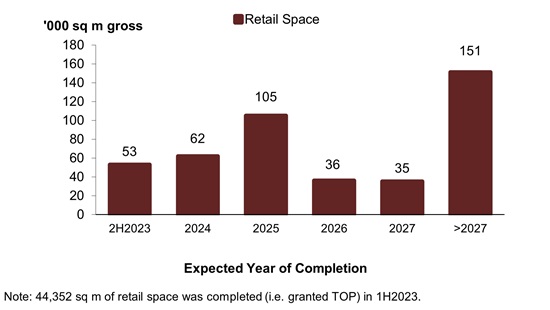
As at the end of 2nd Quarter 2023, there was a total supply of about 442,000 sq m GFA of retail space from projects in the pipeline, compared with the 407,000 sq m GFA of retail space in the pipeline in the previous quarter (see Annexes E-1 [PDF, 59 KB] & E-2 [PDF, 67 KB]).
Pipeline supply of retail space
Stock and Vacancy
The amount of occupied retail space increased by 27,000 sq m (nett) in 2nd Quarter 2023, compared with the decrease of 7,000 sq m (nett) in the previous quarter. The stock of retail space increased by 18,000 sq m (nett) in 2nd Quarter 2023, compared with the increase of 25,000 sq m (nett) in the previous quarter. As a result, the island-wide vacancy rate of retail space decreased to 7.5% as at end of 2nd Quarter 2023, from 7.6% as at end of the previous quarter (see Annexes A-5 [PDF, 73 KB] & E-1 [PDF, 59 KB]).
Stock and vacancy of retail space
URA’S REAL ESTATE INFORMATION SERVICE
More detailed information on the price and rental indices, supply in the pipeline, stock and vacancy rates of the various property sectors can be found in the Real Estate Information System (REALIS), an online database of URA.
More information on REALIS can be found at https://eservice.ura.gov.sg/reis/index.
Table caption
1 | The prices of private residential properties are not uniform and vary from project to project. Home-buyers can view more detailed information on transactions of private residential properties at: https://eservice.ura.gov.sg/property-market-information/pmiResidentialTransactionSearch. Similar information can also be accessed by users on the go via URA’s iphone/ipad application. The application can be downloaded directly from https://itunes.apple.com/app/property-market-information/id573494340?mt=8. |
2 | More detailed data on supply in the pipeline by market segment, development status and expected year of completion can be found at https://eservice.ura.gov.sg/property-market-information/pmiResidentialPipelinePrivateUnits |
3 | In addition, there is a potential supply of around 11,930 units (including ECs) from Government Land Sales (GLS) sites and awarded en-bloc sale sites that have not been granted planning approval yet, of which a significant proportion could be completed from around 2026 onwards. All in all, there are a total of about 61,500 private housing units in the supply pipeline to cater to the housing needs of the population in the next few years. |
SUMMARY OF KEY INFORMATION FOR 2ND QUARTER 2023
Table caption
Annex | Title |
|---|---|
Comparison of Property Price Index for 1st Quarter 2023 and 2nd Quarter 2023 | |
Price Indices of Non-Landed Properties by Market Segment | |
Comparison of Rental Index for 1st Quarter 2023 and 2nd Quarter 2023 | |
Rental Indices of Non-Landed Properties by Market Segment | |
Median Rentals and Vacancy of Office and Retail Space | |
Chart of Property Price Index by Type of Property | |
Chart of Residential Property Price Index by Type | |
Number of Unsold Private Residential Units from Projects with Planning Approvals | |
Number of Unsold Private Residential Units from Projects with Planning Approvals by Market Segment | |
Number of Uncompleted Private Residential Units Launched in the Quarter by Market Segment | |
Number of Private Residential Units Sold in the Quarter by Market Segment | |
Number of New Sale, Sub-Sale and Resale Transactions for Private Residential Units by Market Segment | |
Stock & Vacancy and Supply in the Pipeline as at End of 2nd Quarter 2023 | |
Supply in the Pipeline by Development Status and Expected Year of Completion as at End of 2nd Quarter 2023 | |
Pipeline Supply of Private Residential Units and Executive Condominiums by Expected Year of Completion as at End of 2nd Quarter 2023 | |
Number of Private Residential Units and Executive Condominiums Completed in the Quarter | |
Private Residential and Executive Condominium Projects Completed in 2023 | |
Vacancy of Private Residential Units by Market Segment | |
Number of Executive Condominium Units Launched and Sold in the Quarter |