
Press Releases
Overall private residential prices remained broadly flat while rental momentum eased further amid record supply completions in 3rd Quarter 2023
27 October 2023
This article has been migrated from an earlier version of the site and may display formatting inconsistencies.
• Overall private housing prices increased marginally by 0.8% in 3rd Quarter 2023, following the 0.2% decline in the preceding quarter. The average quarterly price increase of around 0.3% over the past two quarters was significantly lower than the average quarterly increase of 2.1% in the whole of 2022.
• Private residential property rentals rose at a slower pace of 0.8% in 3rd Quarter 2023, compared to the 2.8% increase in the previous quarter. For the fourth consecutive quarter, the increase in rental moderated, and this was the smallest quarter-on-quarter gain since 4th Quarter 2020.
• About 9,000 private residential units (including ECs) were completed in 3rd Quarter 2023, the highest quarterly supply completions since 2nd Quarter 2016. Cumulatively, the supply completions in the first three quarters of 2023 were more than three times that for the same period in 2022. For the whole of 2023, a total of about 20,400 private residential units are expected to be completed, the highest annual supply completion since 2017.
The Urban Redevelopment Authority (URA) released today the real estate statistics for 3rd Quarter 2023.
PRIVATE RESIDENTIAL PROPERTIES
Private residential market at a glance
* Figures exclude Executive Condominium (ECs)
Prices and Rentals
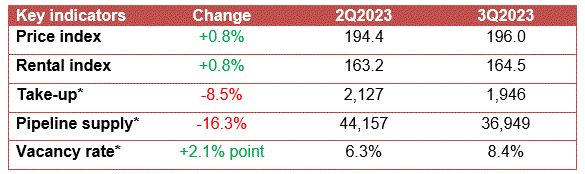
Prices of private residential properties increased by 0.8% in 3rd Quarter 2023, following the 0.2% decline in the previous quarter.
Property Price Index of private residential properties
Prices of landed properties decreased by 3.6% in 3rd Quarter 2023, reversing the 1.1% increase in the previous quarter. Prices of non-landed properties increased by 2.2% in 3rd Quarter 2023, compared with the 0.6% decrease in the previous quarter.
Prices of non-landed properties in Core Central Region (CCR) declined by 2.7% in 3rd Quarter 2023, following the 0.1% decrease in the previous quarter. Prices of non-landed properties in Rest of Central Region (RCR) increased by 2.1% in 3rd Quarter 2023, compared with the 2.5% decrease in the previous quarter. Prices of non-landed properties in Outside Central Region (OCR) increased by 5.5%, compared with the 1.2% increase in the previous quarter (see Annexes A-1 [PDF, 7 KB], A-2 [PDF, 9 KB] & A-6 [PDF, 16 KB]1).
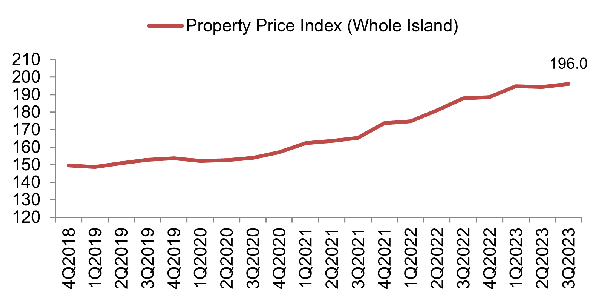
Rentals of private residential properties increased by 0.8% in 3rd Quarter 2023, lower than the 2.8% increase in the previous quarter.
Rental Index of private residential properties
The increase in the rentals of non-landed properties slowed to 0.2%, from the 2.3% increase in the previous quarter. Rentals of landed properties increased by 4.4% in 3rd Quarter 2023, a moderation from the 6.7% increase in the previous quarter.
Rental momentum eased across all market segments. Rentals of non-landed properties in CCR decreased by 1.7% in 3rd Quarter 2023, compared with the 2.0% increase in the previous quarter. Rentals in RCR increased by 1.9%, compared with the 2.0% increase in the previous quarter. The increase in rentals in OCR moderated to 1.3%, compared with the 2.9% increase in the previous quarter (see Annexes A-3 [PDF, 8 KB] & A-4 [PDF, 10 KB]).
Launches and Take-up
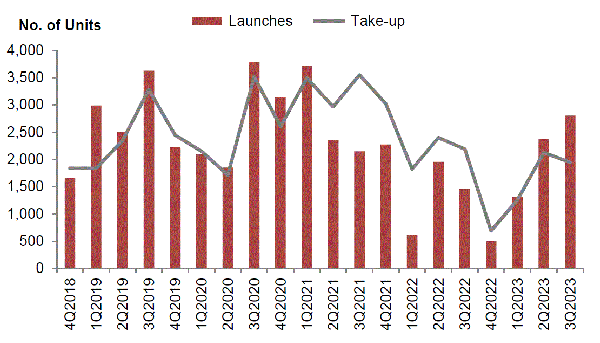
Developers launched 2,805 uncompleted private residential units (excluding ECs) for sale in 3rd Quarter 2023, compared with the 2,374 units in the previous quarter (see Annex C-1 [PDF, 9 KB]).
Developers sold 1,946 private residential units (excluding ECs) in 3rd Quarter 2023, compared with the 2,127 units sold in the previous quarter (see Annex D [PDF, 76 KB]).
Number of private housing units launched and sold by developers (excluding ECs)
Developers launched 360 EC units for sale in 3rd Quarter 2023 and sold 420 EC units in the quarter (see Annex F [PDF, 69 KB]). In comparison, developers did not launch any EC units for sale and sold 57 EC units in the previous quarter.
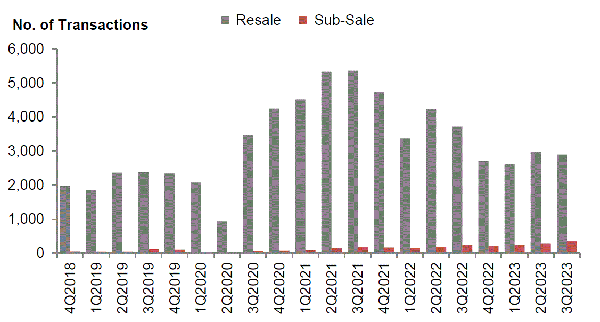
Resales and Sub-sales
There were 2,900 resale transactions in 3rd Quarter 2023, compared with the 2,976 units transacted in the previous quarter. Resale transactions accounted for 55.8% of all sale transactions in 3rd Quarter 2023, compared with 55.2% in the previous quarter (see Annex D [PDF, 76 KB]).
There were 355 sub-sale transactions in 3rd Quarter 2023 compared with the 285 units transacted in the previous quarter. Sub-sales accounted for 6.8% of all sale transactions in 3rd Quarter 2023 compared with 5.3% in the previous quarter (see Annex D [PDF, 76 KB]).
Number of resale and sub-sale transactions for private residential units(excluding ECs)
Supply Completions
A total of 9,013 private residential units (including ECs) were completed in 3rd Quarter 2023. The number of units completed in 3rd Quarter 2023 was the highest quarterly supply completion since 2nd Quarter 2016. Cumulatively, the total completions of 17,199 units in the first three quarters of 2023 were more than three times that for the same period in 2022. Projects completed in the quarter include Treasure At Tampines (2,203 units) and Normanton Park (1,862 units) (see Annexes E-4 [PDF, 8 KB] & E-5 [PDF, 39 KB]).
Supply in the Pipeline
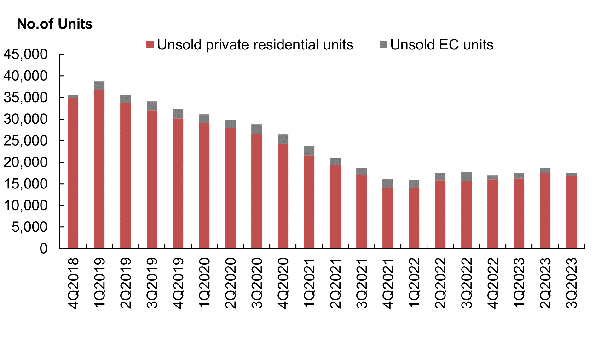
As at the end of 3rd Quarter 2023, there was a total supply of 36,949 uncompleted private residential units (excluding ECs) in the pipeline with planning approvals, of which 16,747 units remained unsold (see Annexes E-1 [PDF, 59 KB], E-2 [PDF, 67 KB] 2, B-1 [PDF, 7 KB] & B-2 [PDF, 10 KB]). After adding the supply of 4,902 EC units in the pipeline, there were 41,851 units (including ECs) in the pipeline with planning approvals, of which 17,576 units remained unsold (see Annex E-3 [PDF, 29 KB]).
Total number of unsold private residential units and ECs in the pipeline
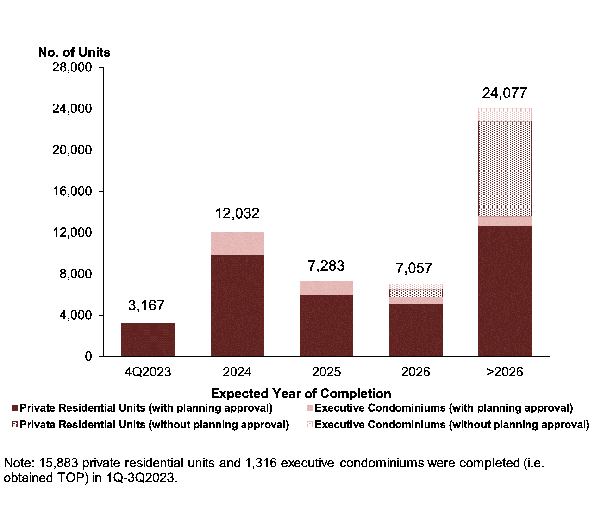
Based on the expected completion dates reported by developers, 3,167 units (including ECs) will be completed in the last quarter of 2023. For the whole of 2023, about 20,400 units (including ECs) are expected to be completed. This would be the highest annual private housing supply completion since 20173. Another 12,032 units (including ECs) will be completed in 2024. In total, around 39,700 units (including ECs) are expected to be completed between 2023 and 20254. This forms part of the total supply of close to 100,000 public and private housing units to be completed between 2023 and 2025, which will help to cater to housing needs in the immediate few years ahead.
Pipeline supply of private residential units and ECs by expected year of completion
Adding the supply of unsold units (including ECs) in the supply pipeline with planning approval, and those that have not been granted planning approval yet, around 29,350 units (including ECs) could be made available for sale later this year or next year. This includes the supply of about 9,250 private housing units on the Confirmed List of the GLS Programme in 2023, which is the highest in a decade. The Government will continue to calibrate housing supply to cater to demand so as to promote a stable and sustainable property market.
Stock and Vacancy
The stock of completed private residential units (excluding ECs) increased by 8,374 units in 3rd Quarter 2023, compared with the increase of 4,227 units in the previous quarter. The stock of occupied private residential units (excluding ECs) decreased by 915 units in 3rd Quarter 2023, compared with the increase of 2,799 units in the previous quarter. As a result, the vacancy rate of completed private residential units (excluding ECs) increased to 8.4% as at end of 3rd Quarter 2023, from 6.3% in the previous quarter (see Annex E-1 [PDF, 59 KB]).
Stock and vacancy of private residential units (excluding ECs)
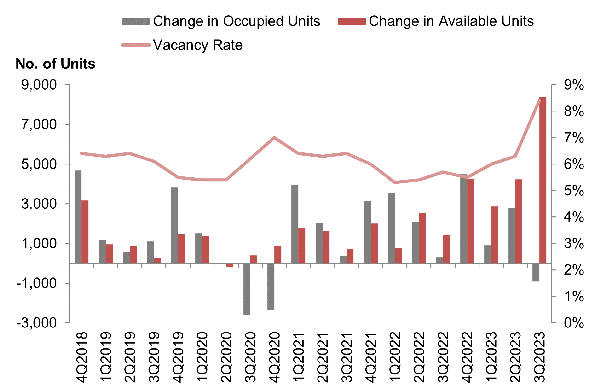
Vacancy rates of completed private residential properties as at the end of 3rd Quarter 2023 in CCR, RCR and OCR were 10.0%, 9.3% and 7.3% respectively, compared with the 7.9%, 7.9% and 4.6% in the previous quarter (see Annex E-6 [PDF, 9 KB])
OFFICE SPACE
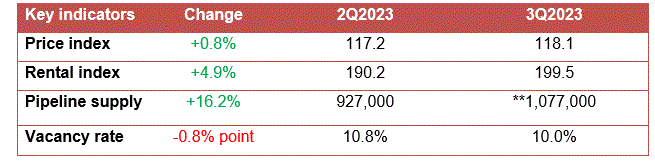
Office market at a glance:
Prices and Rentals
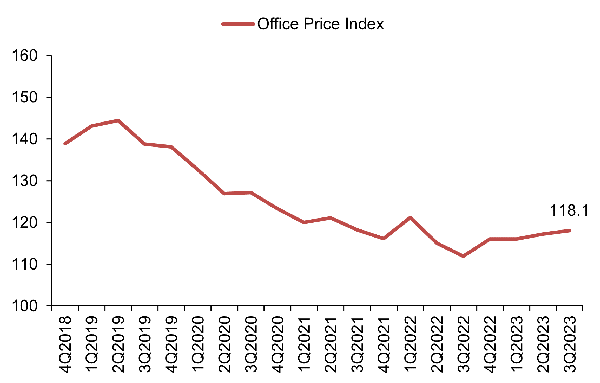
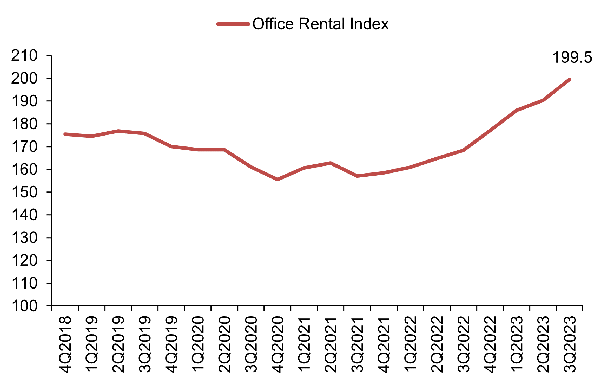
Prices of office space increased by 0.8% in 3rd Quarter 2023, compared with the 1.0% increase in the previous quarter (see Annex A-1 [PDF, 7 KB]). Rentals of office space increased by 4.9% in 3rd Quarter 2023, compared with the 2.3% increase in the previous quarter (see Annexes A-3 [PDF, 8 KB] & A-5 [PDF, 73 KB]).
Property Price Index of office space in Central Region
Rental Index of office space in Central Region
Supply in the Pipeline
As at the end of 3rd Quarter 2023, there was a total supply of about **1,077,000 sq m GFA of office space in the pipeline, compared with the 927,000 sq m GFA of office space in the pipeline in the previous quarter (see Annexes E-1 [PDF, 59 KB] & E-2 [PDF, 67 KB]).
Pipeline supply of office space

Stock and Vacancy
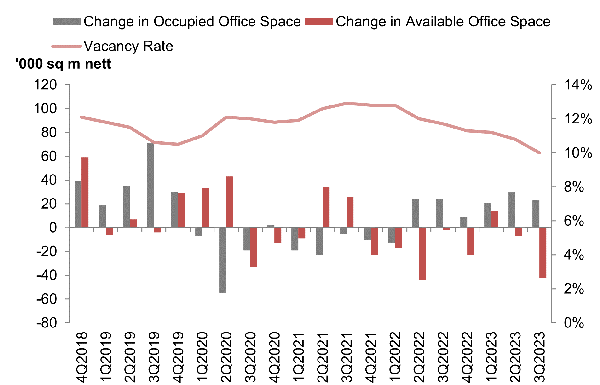
The amount of occupied office space increased by 23,000 sq m (nett) in 3rd Quarter 2023, compared with the increase of 30,000 sq m (nett) in the previous quarter. The stock of office space decreased by 42,000 sq m (nett) in 3rd Quarter 2023, compared with the decrease of 7,000 sq m (nett) in the previous quarter. As a result, the island-wide vacancy rate of office space decreased to 10.0% as at end of 3rd Quarter 2023, from 10.8% as at end of the previous quarter (see Annexes A-5 [PDF, 73 KB] & E-1 [PDF, 59 KB]).
Stock and vacancy of office space
RETAIL SPACE
Prices and Rentals
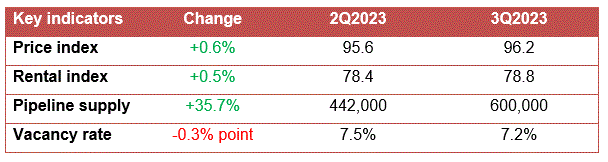
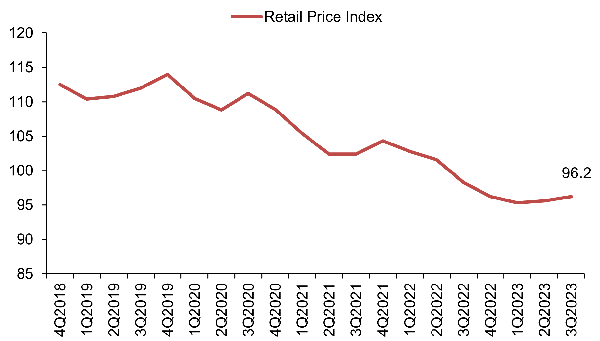
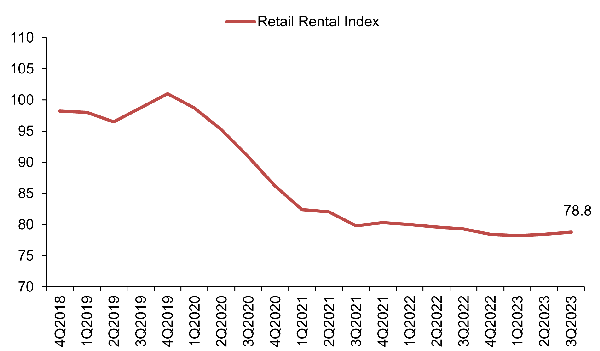
Prices of retail space increased by 0.6% in 3rd Quarter 2023, compared with the 0.3% increase in the previous quarter (see Annex A-1 [PDF, 7 KB]). Rentals of retail space increased by 0.5% in 3rd Quarter 2023, compared with the 0.3% increase in the previous quarter (see Annexes A-3 [PDF, 8 KB] & A-5 [PDF, 73 KB]).
Property Price Index of retail space in Central Region
Rental Index of retail space in Central Region
Supply in the Pipeline
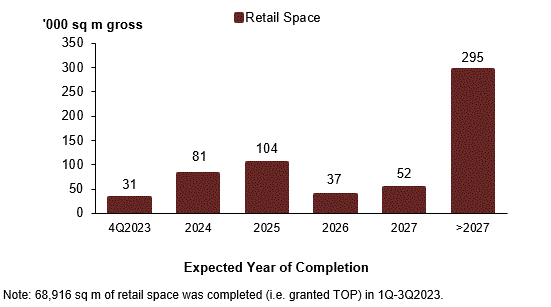
As at the end of 3rd Quarter 2023, there was a total supply of about 600,000 sq m GFA of retail space from projects in the pipeline, compared with the 442,000 sq m GFA of retail space in the pipeline in the previous quarter (see Annexes E-1 [PDF, 59 KB] & E-2 [PDF, 67 KB]).
Pipeline supply of retail space
Stock and Vacancy
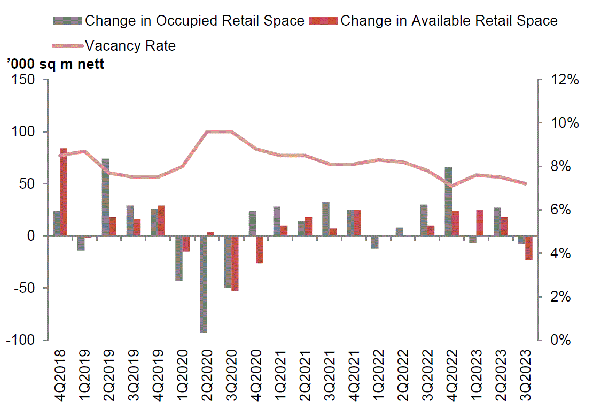
The amount of occupied retail space decreased by 8,000 sq m (nett) in 3rd Quarter 2023, compared with the increase of 27,000 sq m (nett) in the previous quarter. The stock of retail space decreased by 23,000 sq m (nett) in 3rd Quarter 2023, compared with the increase of 18,000 sq m (nett) in the previous quarter. As a result, the island-wide vacancy rate of retail space decreased to 7.2% as at end of 3rd Quarter 2023, from 7.5% as at end of the previous quarter (see Annexes A-5 [PDF, 73 KB] & E-1 [PDF, 59 KB]).
Stock and vacancy of retail space
URA’S REAL ESTATE INFORMATION SERVICE
More detailed information on the price and rental indices, supply in the pipeline, stock and vacancy rates of the various property sectors can be found in the Real Estate Information System (REALIS), an online database of URA.
More information on REALIS can be found at https://eservice.ura.gov.sg/reis/index.
** Data for pipeline office supply updated as of 22 November 2023.
Table caption
1 | The prices of private residential properties are not uniform and vary from project to project. Home-buyers can view more detailed information on transactions of private residential properties at: https://eservice.ura.gov.sg/property-market-information/pmiResidentialTransactionSearch. Similar information can also be accessed by users on the go via URA’s iphone/ipad application. The application can be downloaded directly from https://itunes.apple.com/app/property-market-information/id573494340?mt=8. |
2 | More detailed data on supply in the pipeline by market segment, development status and expected year of completion can be found at https://eservice.ura.gov.sg/property-market-information/pmiResidentialPipelinePrivateUnits |
3 | About 20,600 private housing units (including ECs) were completed in 2017. |
4 | In addition, there is a potential supply of around 11,770 units (including ECs) from Government Land Sales (GLS) sites and awarded en-bloc sale sites that have not been granted planning approval yet, of which a significant proportion could be completed from around 2026 onwards. All in all, there are a total of about 53,600 private housing units in the supply pipeline to cater to the housing needs of the population in the next few years. |
SUMMARY OF KEY INFORMATION FOR 3RD QUARTER 2023
Table caption
Annex | Title |
|---|---|
Comparison of Property Price Index for 2nd Quarter 2023 and 3rd Quarter 2023 | |
Price Indices of Non-Landed Properties by Market Segment | |
Comparison of Rental Index for 2nd Quarter 2023 and 3rd Quarter 2023 | |
Rental Indices of Non-Landed Properties by Market Segment | |
Median Rentals and Vacancy of Office and Retail Space | |
Chart of Property Price Index by Type of Property | |
Chart of Residential Property Price Index by Type | |
Number of Unsold Private Residential Units from Projects with Planning Approvals | |
Number of Unsold Private Residential Units from Projects with Planning Approvals by Market Segment | |
Number of Uncompleted Private Residential Units Launched in the Quarter by Market Segment | |
Number of Private Residential Units Sold in the Quarter by Market Segment | |
Number of New Sale, Sub-Sale and Resale Transactions for Private Residential Units by Market Segment | |
Stock & Vacancy and Supply in the Pipeline as at End of 3rd Quarter 2023 | |
Supply in the Pipeline by Development Status and Expected Year of Completion as at End of 3rd Quarter 2023 | |
Pipeline Supply of Private Residential Units and Executive Condominiums by Expected Year of Completion as at End of 3rd Quarter 2023 | |
Number of Private Residential Units and Executive Condominiums Completed in the Quarter | |
Private Residential and Executive Condominium Projects Completed in 2023 | |
Vacancy of Private Residential Units by Market Segment | |
Number of Executive Condominium Units Launched and Sold in the Quarter |