
Press Releases
Release of 1st Quarter 2024 real estate statistics
26 April 2024
This article has been migrated from an earlier version of the site and may display formatting inconsistencies.
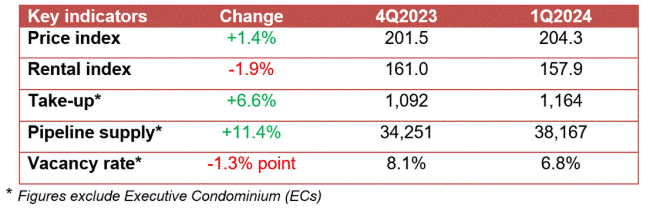
• Price and rental momentum in the private residential market showed moderation in the 1st Quarter of 2024. Overall private housing prices rose at a slower pace of 1.4% in 1st Quarter 2024 compared to the 2.8% increase in the previous quarter. Overall, private housing rentals fell for the second consecutive quarter by 1.9% in 1st Quarter 2024, following a 2.1% decline in 4th Quarter 2023.
• The Government Land Sales supply for private housing increased further in 1H2024, with the release of 5,450 units. This marks the highest supply on the Confirmed List in a single GLS Programme since 2H2013. The increased private housing supply from the GLS Programme will be ready for sales launch in the coming year, to cater to purchase demand and help maintain price stability in line with economic fundamentals.
• The economic outlook is subject to uncertainties, particularly stemming from ongoing geopolitical conflicts that could precipitate negative global supply and demand shocks. Domestic mortgage rates are expected to remain at relatively higher levels as compared to the low levels seen over the past decade. Households are advised to exercise prudence when taking on new financial commitments, including long-term mortgage debt servicing obligations.
The Urban Redevelopment Authority (URA) released today the real estate statistics for 1st Quarter 2024.
PRIVATE RESIDENTIAL PROPERTIES
Private residential market at a glance:
Prices and Rentals
Prices of private residential properties increased by 1.4% in 1st Quarter 2024, compared with the 2.8% increase in the previous quarter.
Property Price Index of private residential properties
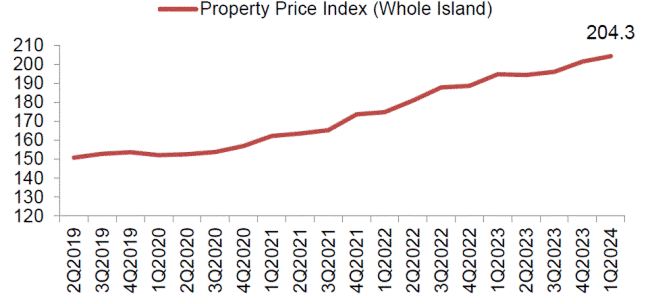
Prices of landed properties increased by 2.6% in 1st Quarter 2024, a moderation from the 4.6% increase in the previous quarter. Prices of non-landed properties increased by 1.0% in 1st Quarter 2024, compared with the 2.3% increase in the previous quarter.
Prices of non-landed properties in Core Central Region (CCR) increased by 3.4% in 1st Quarter 2024, following the 3.9% increase in the previous quarter. Prices of non-landed properties in Rest of Central Region (RCR) increased by 0.3% in 1st Quarter 2024, compared with the 0.8% decrease in the previous quarter. Prices of non-landed properties in Outside Central Region (OCR) increased by 0.2% in 1st Quarter 2024, compared with the 4.5% increase in the previous quarter (see Annexes A-1 [PDF, 26 KB], A-2 [PDF, 28 KB] & A-6 [PDF, 35 KB]1).
Rentals of private residential properties decreased by 1.9% in 1st Quarter 2024, extending the 2.1% decrease in the previous quarter.
Rental Index of private residential properties
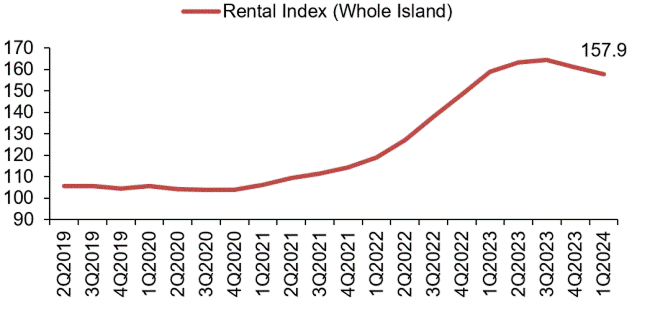
Rentals of non-landed properties decreased by 1.6% in 1st Quarter 2024, following the 1.8% decrease in the previous quarter. Rentals of landed properties decreased by 4.2% in 1st Quarter 2024, similar to the 4.1% decrease in the previous quarter.
Rentals of non-landed properties in CCR decreased by 1.6% in 1st Quarter 2024, same as the decrease of 1.6% in the previous quarter. Rentals in RCR decreased by 1.9% in 1st Quarter 2024, compared with the 1.2% decrease in the previous quarter. Rentals in OCR decreased by 1.4% in 1st Quarter 2024, compared with the 2.8% decrease in the previous quarter (see Annexes A-3 [PDF, 27 KB] & A-4 [PDF, 29 KB]).
Launches and Take-up
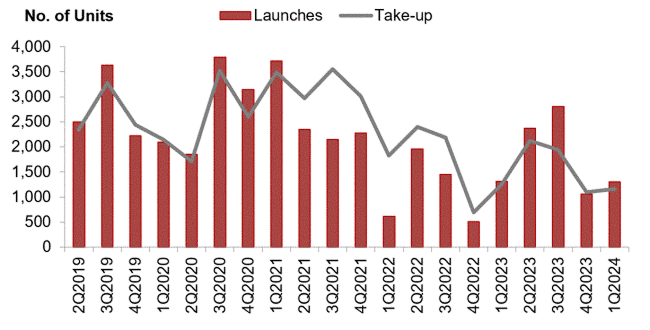
Developers launched 1,304 uncompleted private residential units (excluding ECs) for sale in 1st Quarter 2024, compared with the 1,060 units in the previous quarter (see Annex C-1 [PDF, 30 KB]).
Developers sold 1,164 private residential units (excluding ECs) in 1st Quarter 2024, compared with the 1,092 units sold in the previous quarter (see Annex D [PDF, 95 KB]).
Number of private housing units launched and sold by developers (excluding ECs)
Developers launched 512 EC units for sale in 1st Quarter 2024 and sold 449 EC units in the quarter (see Annex F [PDF, 89 KB]). In comparison, developers did not launch any EC units for sale and sold 54 EC units in the previous quarter.
Resales and Sub-sales
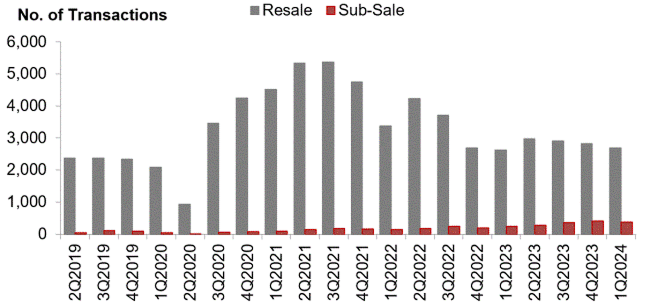
There were 2,689 resale transactions in 1st Quarter 2024, compared with the 2,831 units transacted in the previous quarter. Resale transactions accounted for 63.6% of all sale transactions in 1st Quarter 2024, compared with 65.3% in the previous quarter (see Annex D [PDF, 95 KB]).
There were 377 sub-sale transactions in 1st Quarter 2024, compared with the 411 units transacted in the previous quarter. Sub-sales accounted for 8.9% of all sale transactions in 1st Quarter 2024, compared with 9.5% in the previous quarter (See Annex D [PDF, 95 KB]).
Number of resale and sub-sale transactions for private residential units (excluding ECs)
Supply Completions
A total of 241 private residential units were completed in 1st Quarter 2024 (see Annexes E-4 [PDF, 28 KB] & E-5 [PDF, 44 KB]).
Supply in the Pipeline
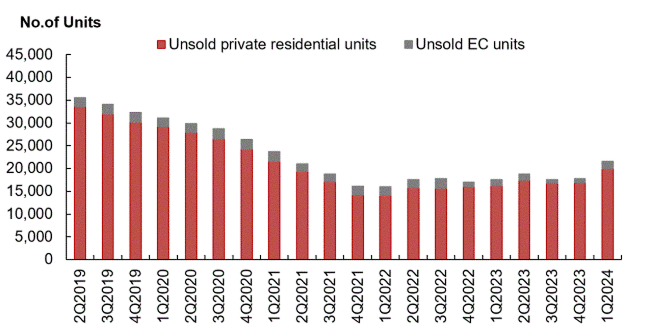
As at the end of 1st Quarter 2024, there was a total supply of 38,167 uncompleted private residential units (excluding ECs) in the pipeline with planning approvals, of which 19,936 units remained unsold (see Annexes E-1 [PDF, 78 KB], E-2 [PDF, 85 KB]2, B-1 [PDF, 26 KB] & B-2 [PDF, 29 KB]). After adding the supply of 6,170 EC units in the pipeline, there were 44,337 units (including ECs) in the pipeline with planning approvals, of which 21,562 units remained unsold, compared to 17,729 in the previous quarter (see Annex E-3 [PDF, 48 KB]).
Total number of unsold private residential units and ECs in the pipeline
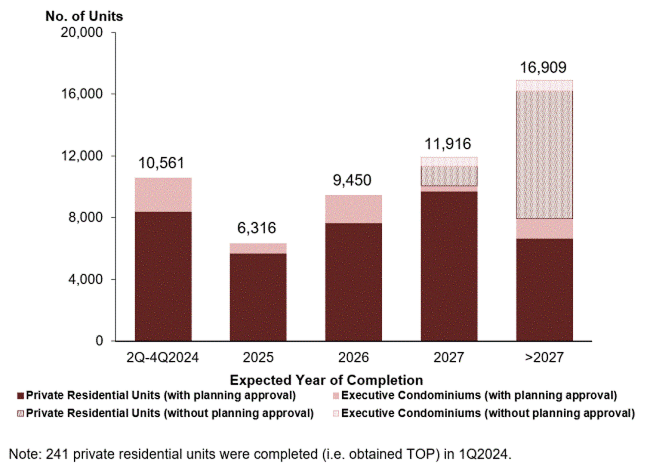
Based on the expected completion dates reported by developers, 10,561 units (including ECs) will be completed in the remaining 3 quarters of 2024. Another 6,316 units (including ECs) are expected to be completed in 2025. In total, about 17,100 units (including ECs) are expected to be completed in 2024 and 20253, forming part of the total supply of close to 100,000 public and private housing units to be completed between 2023 and 2025. More supply, amounting to about 38,300 units are expected to be completed in 2026 and beyond to cater to demand in the medium term.
Pipeline supply of private residential units and ECs by expected year of completion
Adding the supply of unsold units (including ECs) in the supply pipeline with planning approval, and those that have not been granted planning approval yet, around 32,380 units (including ECs) could be made available for sale later this year or next year. This includes the supply of about 5,450 private housing units on the Confirmed List of the GLS Programme in 1H2024, which is the highest supply on the Confirmed List in a single GLS Programme since 2H2013. The Government will continue to calibrate housing supply to cater to demand so as to promote a stable and sustainable property market.
Stock and Vacancy
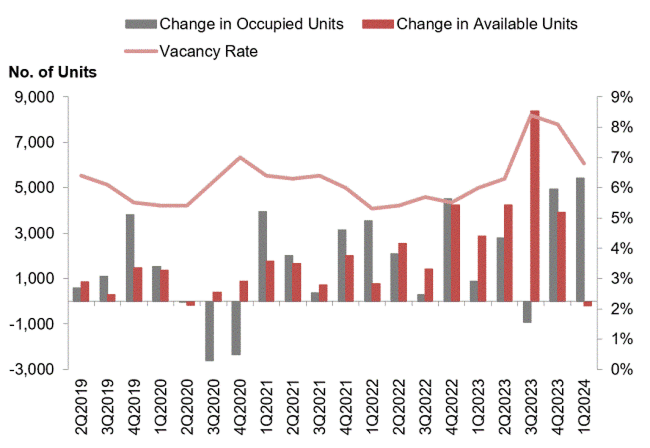
The stock of completed private residential units (excluding ECs) decreased by 188 units in 1st Quarter 2024, compared with the increase of 3,925 units in the previous quarter. The stock of occupied private residential units (excluding ECs) increased by 5,423 units in 1st Quarter 2024, compared with the increase of 4,926 units in the previous quarter. As a result, the vacancy rate of completed private residential units (excluding ECs) decreased to 6.8% as at end of 1st Quarter 2024, from 8.1% in the previous quarter (see Annex E-1 [PDF, 78 KB]).
Stock and vacancy of private residential units (excluding ECs)
Vacancy rates of completed private residential properties as at the end of 1st Quarter 2024 in CCR, RCR and OCR were 8.9%, 6.6% and 6.0% respectively, compared with the 9.8%, 8.1% and 7.4% in the previous quarter (see Annex E-6 [PDF, 28 KB])
OFFICE SPACE

Prices and Rentals
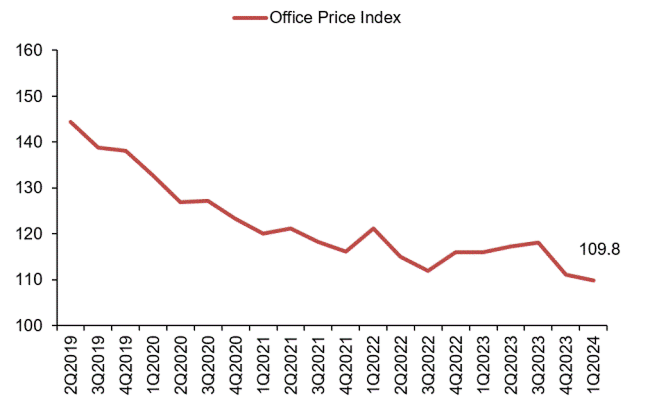
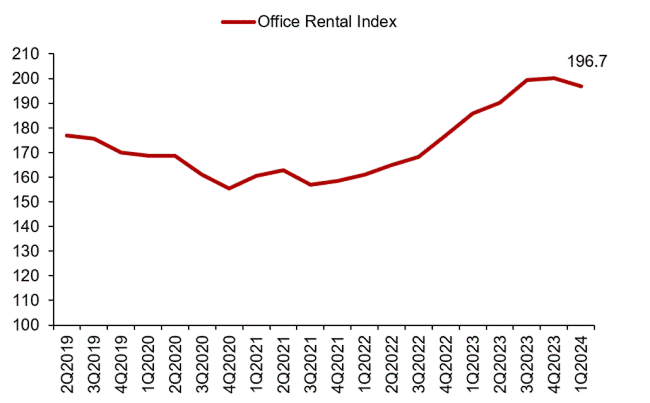
Prices of office space decreased by 1.2% in 1st Quarter 2024, compared with the 5.9% decrease in the previous quarter (see Annex A-1 [PDF, 26 KB]). Rentals of office space decreased by 1.7% in 1st Quarter 2024, compared with the 0.3% increase in the previous quarter (see Annexes A-3 [PDF, 27 KB] & A-5 [PDF, 92 KB]).
Property Price Index of office space in Central Region
Rental Index of office space in Central Region
Supply in the Pipeline
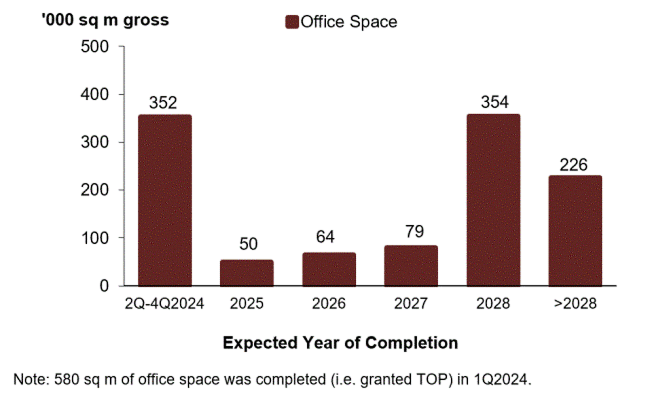
As at the end of 1st Quarter 2024, there was a total supply of about 1,125,000 sq m GFA of office space in the pipeline, compared with the 1,126,000 sq m GFA of office space in the pipeline in the previous quarter (see Annexes E-1 [PDF, 78 KB] & E-2 [PDF, 85 KB]).
Pipeline supply of office space
Stock and Vacancy
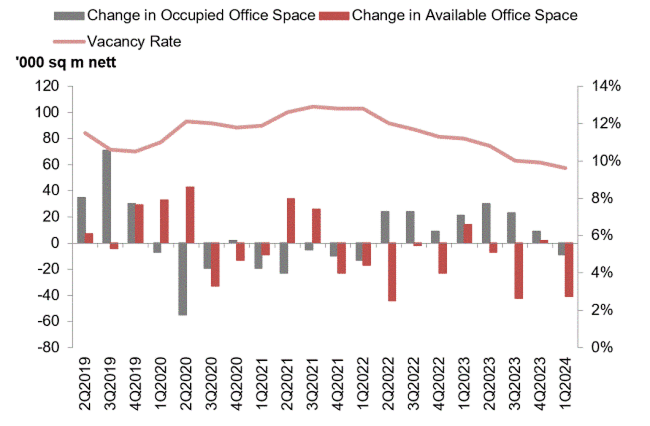
The amount of occupied office space decreased by 9,000 sq m (nett) in 1st Quarter 2024, reversing the increase of 9,000 sq m (nett) in the previous quarter. The stock of office space decreased by 41,000 sq m (nett) in 1st Quarter 2024, compared with the increase of 2,000 sq m (nett) in the previous quarter. As a result, the island-wide vacancy rate of office space decreased to 9.6% as at end of 1st Quarter 2024, from 9.9% as at end of the previous quarter (see Annexes A-5 [PDF, 92 KB] & E-1 [PDF, 78 KB]).
Stock and vacancy of office space
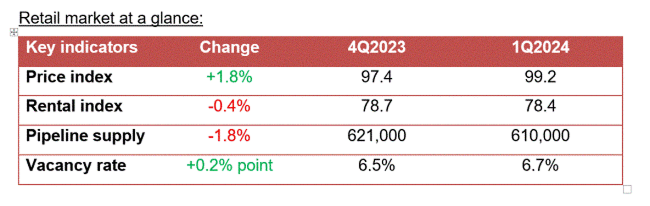
RETAIL SPACE
Prices and Rentals
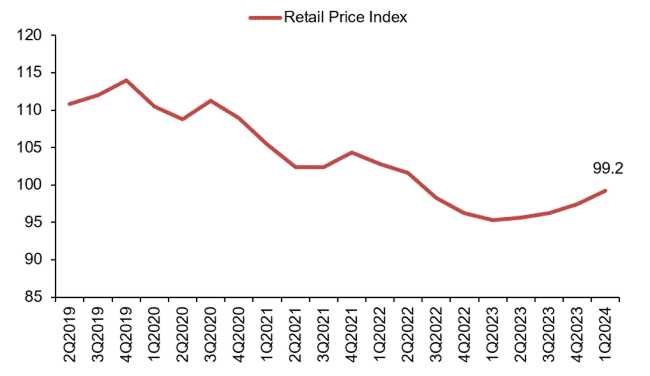
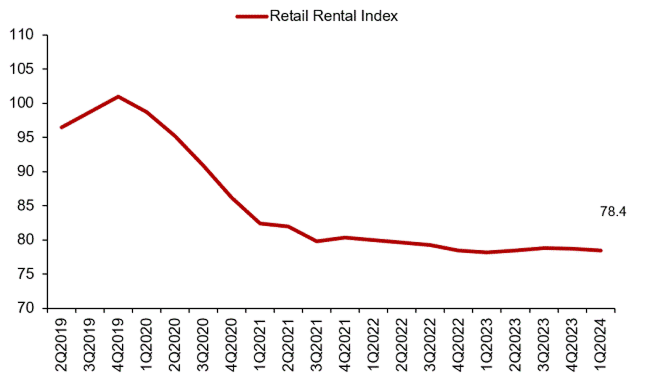
Prices of retail space increased by 1.8% in 1st Quarter 2024, compared with the 1.2% increase in the previous quarter (see Annex A-1 [PDF, 26 KB]). Rentals of retail space decreased by 0.4% in 1st Quarter 2024, compared with the 0.1% decrease in the previous quarter (see Annexes A-3 [PDF, 27 KB] & A-5 [PDF, 92 KB]).
Property Price Index of retail space in Central Region
Rental Index of retail space in Central Region
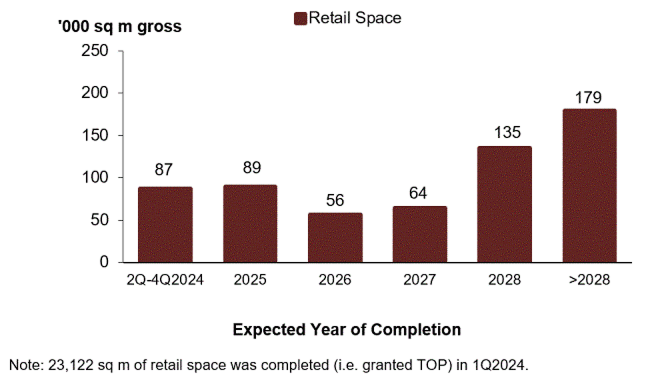
Supply in the Pipeline
As at the end of 1st Quarter 2024, there was a total supply of about 610,000 sq m GFA of retail space in the pipeline, compared with the 621,000 sq m GFA of retail space in the pipeline in the previous quarter (see Annexes E-1 [PDF, 78 KB] & E-2 [PDF, 85 KB]).
Pipeline supply of retail space
Stock and Vacancy
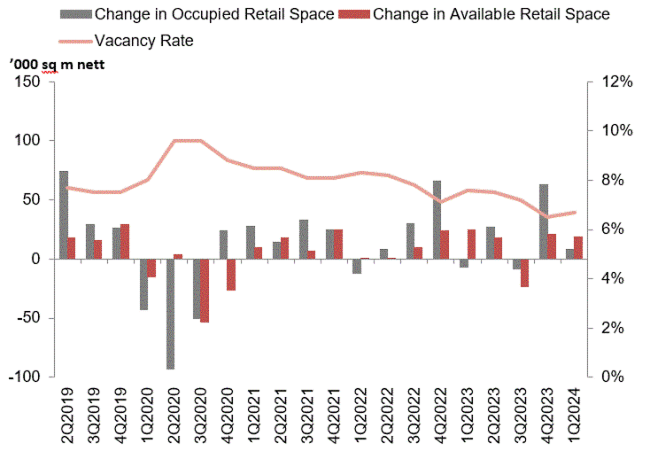
The amount of occupied retail space increased by 8,000 sq m (nett) in 1st Quarter 2024, compared with the increase of 63,000 sq m (nett) in the previous quarter. The stock of retail space increased by 19,000 sq m (nett) in 1st Quarter 2024, compared with the increase of 21,000 sq m (nett) in the previous quarter. As a result, the island-wide vacancy rate of retail space increased to 6.7% as at end of 1st Quarter 2024, from 6.5% as at end of the previous quarter (see Annexes A-5 [PDF, 92.09 KB] & E-1 [PDF, 77.67 KB]).
Stock and vacancy of retail space
URA’S REAL ESTATE INFORMATION SERVICE
More detailed information on the price and rental indices, supply in the pipeline, stock and vacancy rates of the various property sectors can be found in the Real Estate Information System (REALIS), an online database of URA.
More information on REALIS can be found at https://eservice.ura.gov.sg/reis/index.
Table caption
1 | The prices of private residential properties are not uniform and vary from project to project. Home-buyers can view more detailed information on transactions of private residential properties at: https://eservice.ura.gov.sg/property-market-information/pmiResidentialTransactionSearch . Similar information can also be accessed by users on the go via URA’s iphone/ipad application. The application can be downloaded directly from https://itunes.apple.com/app/property-market-information/id573494340?mt=8 . |
|---|---|
2 | More detailed data on supply in the pipeline by market segment, development status and expected year of completion can be found at https://eservice.ura.gov.sg/property-market-information/pmiResidentialPipelinePrivateUnits . |
3 | In addition, there is a potential supply of around 10,820 units (including ECs) from Government Land Sales (GLS) sites and awarded en-bloc sale sites that have not been granted planning approval yet, of which a significant proportion could be completed from around 2027 onwards. All in all, there are a total of about 55,200 private housing units in the supply pipeline to cater to the housing needs of the population in the next few years. |
SUMMARY OF KEY INFORMATION FOR 1ST QUARTER 2024
Table caption
Annex | Title |
|---|---|
| Comparison of Property Price Index for 4th Quarter 2023 and 1st Quarter 2024 |
| Price Indices of Non-Landed Properties by Market Segment |
| Comparison of Rental Index for 4th Quarter 2023 and 1st Quarter 2024 |
| Rental Indices of Non-Landed Properties by Market Segment |
| Median Rentals and Vacancy of Office and Retail Space |
| Chart of Property Price Index by Type of Property |
| Chart of Residential Property Price Index by Type |
| Number of Unsold Private Residential Units from Projects with Planning Approvals |
| Number of Unsold Private Residential Units from Projects with Planning Approvals by Market Segment |
| Number of Uncompleted Private Residential Units Launched in the Quarter by Market Segment |
| Number of Private Residential Units Sold in the Quarter by Market Segment |
| Number of New Sale, Sub-Sale and Resale Transactions for Private Residential Units by Market Segment |
| Stock & Vacancy and Supply in the Pipeline as at End of 1st Quarter 2024 |
| Supply in the Pipeline by Development Status and Expected Year of Completion as at End of 1st Quarter 2024 |
| Pipeline Supply of Private Residential Units and Executive Condominiums by Expected Year of Completion as at End of 1st Quarter 2024 |
| Number of Private Residential Units and Executive Condominiums Completed in the Quarter |
| Private Residential and Executive Condominium Projects Completed in 2024 |
| Vacancy of Private Residential Units by Market Segment |
| Number of Executive Condominium Units Launched and Sold in the Quarter |