
Press Releases
Release of 4th Quarter 2021 real estate statistics
28 January 2022
This article has been migrated from an earlier version of the site and may display formatting inconsistencies.
The Urban Redevelopment Authority (URA) released today the real estate statistics for 4th Quarter 2021.1
PRIVATE RESIDENTIAL PROPERTIES
Private residential market at a glance:
Prices and Rentals
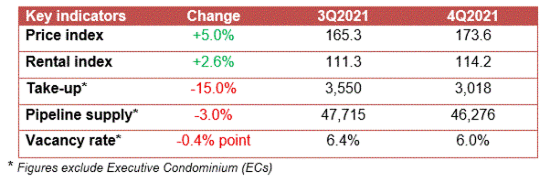
Prices of private residential properties increased by 5.0% in 4th Quarter 2021, compared with the 1.1% increase in the previous quarter. For the whole of 2021, prices of private residential properties increased by 10.6%, compared with the 2.2% increase in 2020.
Property Price Index of private residential properties
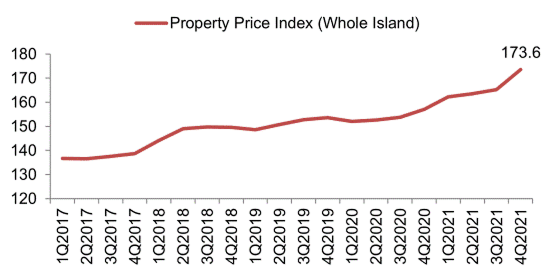
Prices of landed properties increased by 3.9% in 4th Quarter 2021, compared with the 2.6% increase in the previous quarter. Prices of non-landed properties increased by 5.3% in 4th Quarter 2021, compared with the 0.7% increase in the previous quarter. For the whole of 2021, prices of landed properties rose by 13.3% while those of non-landed properties rose by 9.8%.
Prices of non-landed properties in Core Central Region (CCR) increased by 2.7% in 4th Quarter 2021, compared with the 0.5% decrease in the previous quarter. Prices of non-landed properties in Rest of Central Region (RCR) increased by 6.7%, compared with the 2.6% increase in the previous quarter. Prices of non-landed properties in Outside Central Region (OCR) increased by 5.7%, compared with the 0.1% decrease in the previous quarter. For the whole of 2021, prices of non-landed properties in CCR, RCR and OCR increased by 3.8%, 16.3% and 8.8% respectively (see Annexes A-1a [PDF, 7 KB] (opens in new tab), A-1b [PDF, 7 KB] (opens in new tab), A-2 [PDF, 9 KB] (opens in new tab) & A-6 [PDF, 15 KB] (opens in new tab)2).
Rentals of private residential properties increased by 2.6% in 4th Quarter 2021, compared with the 1.8% increase in the previous quarter. For the whole of 2021, rentals of private residential properties increased by 9.9% compared with the 0.6% decrease in 2020.
Rental Index of private residential properties
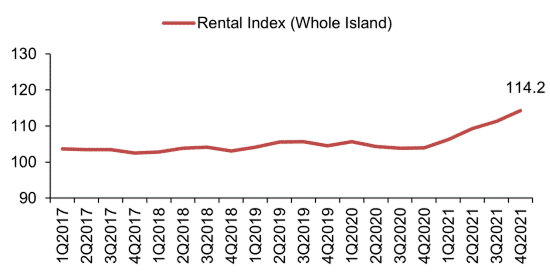
Rentals of landed properties increased by 1.2% in 4th Quarter 2021, compared with the 4.7% increase in the previous quarter. Rentals of non-landed properties increased by 2.7%, compared with the 1.4% increase in the previous quarter. For the whole of 2021, rentals of landed properties increased by 8.2% while rentals of non-landed properties increased by 9.9%.
Rentals of non-landed properties in CCR increased by 2.9% in 4th Quarter 2021, compared with the 0.7% increase in the previous quarter. Rentals in RCR increased by 2.8%, compared with the 1.6% increase in the previous quarter. Rentals in OCR increased by 2.4%, compared with the 2.6% increase in the previous quarter. For the whole of 2021, rentals of non-landed properties in CCR, RCR and OCR increased by 9.8%, 9.5% and 11.1% respectively (see Annexes A-3a [PDF, 8 KB] (opens in new tab), A-3b [PDF, 8 KB] (opens in new tab) & A-4 [PDF, 10 KB] (opens in new tab)).
Launches and Take-up
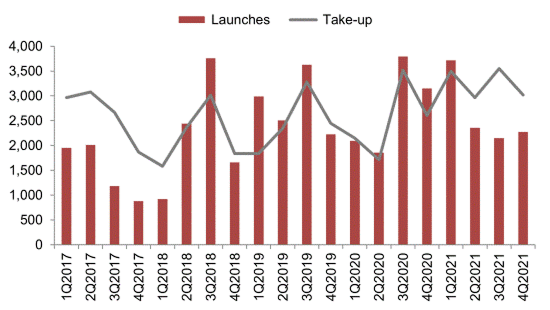
Developers launched 2,275 uncompleted private residential units (excluding ECs) for sale in 4th Quarter 2021, compared with the 2,149 units in the previous quarter. For the whole of 2021, developers launched 10,496 uncompleted private residential properties for sale, compared with the 10,883 units in the previous year (see Annex C-1 [PDF, 10 KB] (opens in new tab)).
Developers sold 3,018 private residential units (excluding ECs) in 4th Quarter 2021, compared with the 3,550 units sold in the previous quarter. For the whole of 2021, developers sold 13,027 private residential units, compared with the 9,982 units in the previous year (see Annex D [PDF, 78 KB] (opens in new tab)).
Number of private housing units launched and sold by developers (excluding ECs)
Developers did not launch any EC units for sale in 4th Quarter 2021, and sold 260 EC units in the quarter (see Annex F [PDF, 69 KB] (opens in new tab)). In comparison, developers launched 496 EC units and sold 717 EC units in the previous quarter. For the whole of 2021, developers launched 1,609 EC units for sale and sold 2,119 EC units, compared with the 1,044 units launched and 958 units sold in 2020.
Resales and Sub-sales
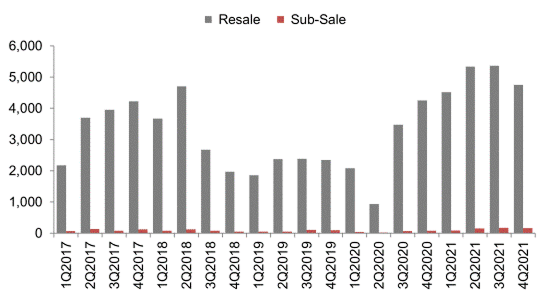
There were 4,748 resale transactions in 4th Quarter 2021, compared with the 5,362 units transacted in the previous quarter. Resale transactions accounted for 59.9% of all sale transactions in 4th Quarter 2021, compared with 59.0% in the previous quarter (see Annex D [PDF, 78 KB] (opens in new tab)). For the whole of 2021, there were 19,962 resale transactions, compared with the 10,729 resale transactions in 2020.
There were 159 sub-sale transactions in 4th Quarter 2021, compared with the 171 units transacted in the previous quarter. Sub-sales accounted for 2.0% of all sale transactions in 4th Quarter 2021, compared with 1.9% in the previous quarter (see Annex D [PDF, 78 KB] (opens in new tab)). For the whole of 2021, there were 568 sub-sale transactions, compared with the 198 sub-sale transactions in 2020.
Number of resale and sub-sale transactions for private residential units (excluding ECs)
These statistics on the private residential market, including the price trend and transaction volume for the whole of 2021, largely reflect market conditions prior to the implementation of the latest round of property market cooling measures on 16 December 2021.
Supply in the Pipeline
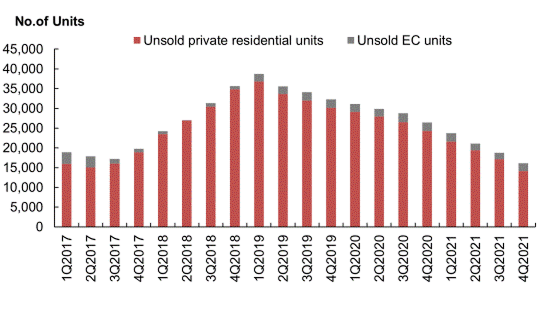
As at the end of 4th Quarter 2021, there was a total supply of 46,276 uncompleted private residential units (excluding ECs) in the pipeline with planning approvals3, compared with the 47,715 units in the previous quarter (see Annexes E-1 [PDF, 58 KB] (opens in new tab) & E-2 [PDF, 66 KB] (opens in new tab)4). Of this number, 14,154 units remained unsold as at the end of 4th Quarter 2021, compared with the 17,140 units in the previous quarter (see Annexes B-1 [PDF, 7 KB] (opens in new tab) & B-2 [PDF, 10 KB] (opens in new tab)).
After adding the supply of 5,333 EC units in the pipeline, there were 51,609 units in the pipeline with planning approvals (see Annex E-3 [PDF, 27 KB] (opens in new tab)). Of the EC units in the pipeline, 1,985 units remained unsold. In total, 16,139 units with planning approvals (including ECs) remained unsold, compared to 18,721 units in the previous quarter and 26,426 units a year ago.
Total number of unsold private residential units in the pipeline
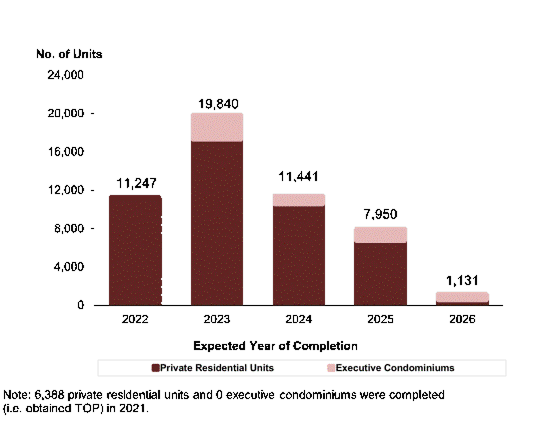
Based on the expected completion dates reported by developers, 11,247 units (including ECs) will be completed in 2022. Another 19,840 units (including ECs) are expected to be completed in 2023.
Pipeline supply of private residential units and ECs (with planning approvals) by expected year of completion
Apart from the 16,139 unsold units (including ECs) with planning approval as at the end of 4th Quarter 2021, there is a potential supply of around 6,900 units (including ECs) from Government Land Sales (GLS) sites that have not been granted planning approval yet.5
The supply of private housing in the pipeline, including from GLS sites, will sufficiently cater to the housing needs of the population when completed over the next few years. The Government will continue to monitor economic and property market conditions closely and adjust the supply of future GLS Programmes, where necessary, to ensure it remains adequate in meeting demand.
Stock and Vacancy
The stock of completed private residential units (excluding ECs) increased by 2,008 units in 4th Quarter 2021, compared with the increase of 725 units in the previous quarter. The stock of occupied private residential units (excluding ECs) increased by 3,147 units in 4th Quarter 2021, compared with the increase of 380 units in the previous quarter. As a result, the vacancy rate of completed private residential units (excluding ECs) decreased to 6.0% as at the end of 4th Quarter 2021, from 6.4% in the previous quarter (see Annex E-1 [PDF, 58 KB] (opens in new tab)).
Stock and vacancy of private residential units (excluding ECs)
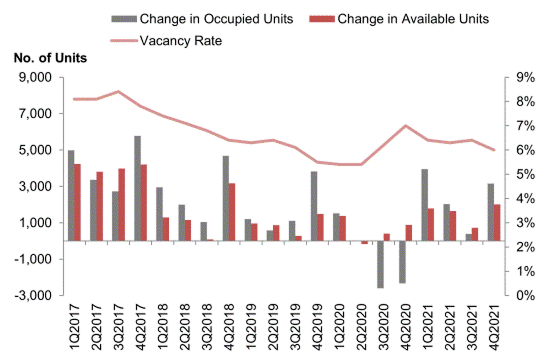
Vacancy rates of completed private residential properties as at the end of 4th Quarter 2021 in CCR, RCR and OCR were 9.3%, 7.0% and 4.1% respectively, compared with the 9.7%, 6.5% and 4.8% in the previous quarter (see Annex E-4 [PDF, 9 KB] (opens in new tab)).
OFFICE SPACE
Office market at a glance:
Prices and Rentals
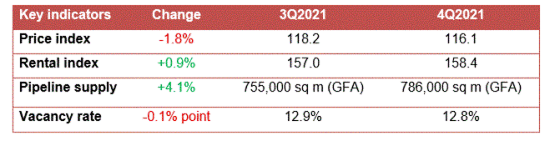
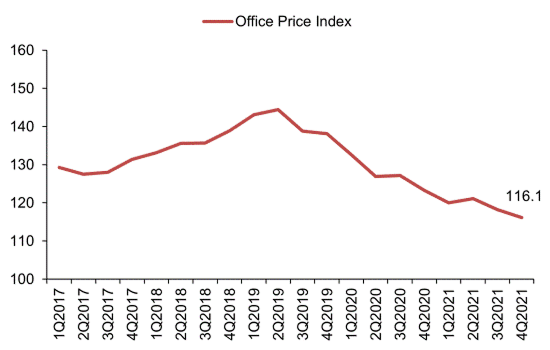
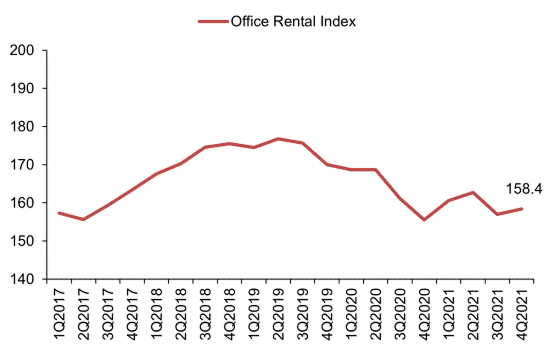
Prices of office space decreased by 1.8% in 4th Quarter 2021, compared with the 2.4% decrease in the previous quarter (see Annexes A-1a [PDF, 7 KB] (opens in new tab) & A-1b [PDF, 7 KB] (opens in new tab)). Rentals of office space increased by 0.9% in 4th Quarter 2021, compared with the 3.5% decrease in the previous quarter. For the whole of 2021, prices of office space decreased by 5.8%, compared with the decrease of 10.7% in 2020, while rentals of office space increased by 1.9%, compared with the decrease of 8.5% in 2020 (see Annexes A-3a [PDF, 8 KB] (opens in new tab), A-3b [PDF, 8 KB] (opens in new tab) & A-5 [PDF, 72 KB] (opens in new tab)).
Property Price Index of office space in Central Region
Rental Index of office space in Central Region
Supply in the Pipeline
As at the end of 4th Quarter 2021, there was a total supply of about 786,000 sq m GFA of office space in the pipeline, compared with the 755,000 sq m GFA of office space in the pipeline in the previous quarter (see Annexes E-1 [PDF, 58 KB] (opens in new tab) & E-2 [PDF, 66 KB] (opens in new tab)).
Pipeline supply of office space

Stock and Vacancy
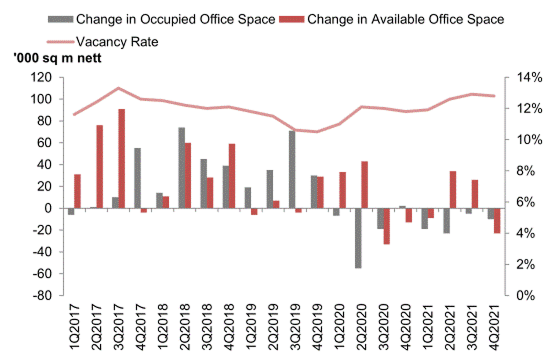
The amount of occupied office space decreased by 10,000 sq m (nett) in 4th Quarter 2021, compared with the decrease of 5,000 sq m (nett) in the previous quarter. The stock of office space decreased by 23,000 sq m (nett) in 4th Quarter 2021, compared with the increase of 26,000 sq m (nett) in the previous quarter. As a result, the island-wide vacancy rate of office space decreased to 12.8% as at the end of 4th Quarter 2021, from 12.9% as at the end of the previous quarter (see Annexes A-5 [PDF, 72 KB] (opens in new tab) & E-1 [PDF, 58 KB] (opens in new tab)).
Stock and vacancy of office space
RETAIL SPACE
Retail market at a glance:
Prices and Rentals
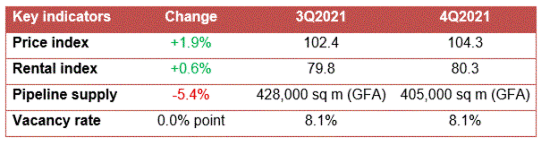
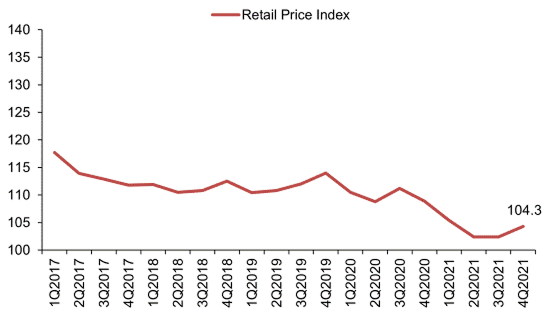
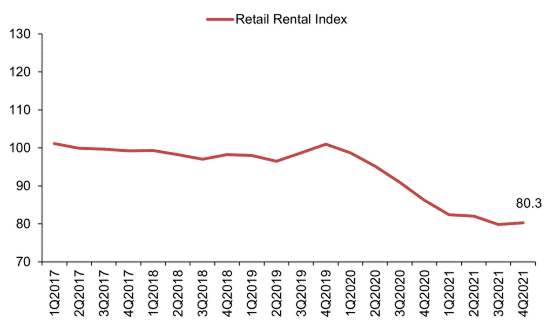
Prices of retail space increased by 1.9% in 4th Quarter 2021, after remaining unchanged in the previous quarter(see Annexes A-1a [PDF, 7 KB] (opens in new tab) & A-1b [PDF, 7 KB] (opens in new tab)). Rentals of retail space increased by 0.6% in 4th Quarter 2021, following the decrease of 2.7% in the previous quarter. For the whole of 2021, prices of retail space decreased by 4.2%, compared with the decrease of 4.5% in 2020, while rentals of retail space decreased by 6.8%, compared with the decrease of 14.7% in 2020 (see Annexes A-3a [PDF, 8 KB] (opens in new tab), A-3b [PDF, 8 KB] (opens in new tab) & A-5 [PDF, 72 KB] (opens in new tab)).
Property Price Index of retail space in Central Region
Rental Index of retail space in Central Region
Supply in the Pipeline
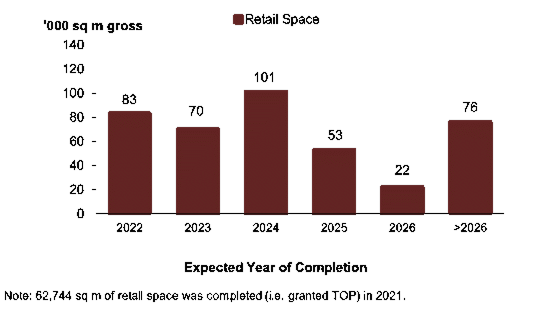
As at the end of 4th Quarter 2021, there was a total supply of 405,000 sq m GFA of retail space from projects in the pipeline, compared with the 428,000 sq m GFA of retail space in the pipeline in the previous quarter (see Annexes E-1 [PDF, 58 KB] (opens in new tab) & E-2 [PDF, 66 KB] (opens in new tab)).
Pipeline supply of retail space
Stock and Vacancy
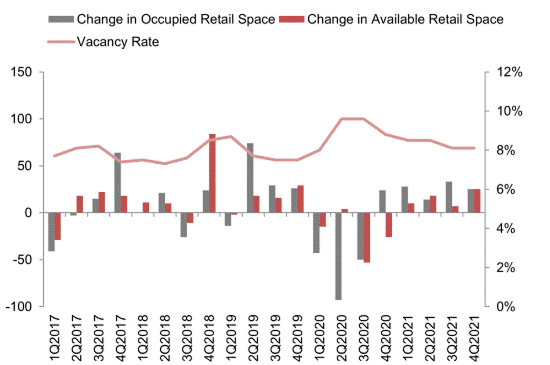
The amount of occupied retail space increased by 25,000 sq m (nett) in 4th Quarter 2021, compared with the increase of 33,000 sq m (nett) in the previous quarter. The stock of retail space increased by 25,000 sq m (nett) in 4th Quarter 2021, compared with the increase of 7,000 sq m (nett) in the previous quarter. As a result, the island-wide vacancy rate of retail space remained unchanged at 8.1% as at the end of 4th Quarter 2021 (see Annexes A-5 [PDF, 72 KB] (opens in new tab) & E-1 [PDF, 58 KB] (opens in new tab)).
Stock and vacancy of retail space
URA’S REAL ESTATE INFORMATION SERVICE
More detailed information on the price and rental indices, supply in the pipeline, stock and vacancy rates of the various property sectors can be found in the Real Estate Information System (REALIS), an online database of URA.
More information on REALIS can be found at https://eservice.ura.gov.sg/reis/index (opens in new tab).
Table caption
1 | Statistics in this press release are based on quarter to quarter comparisons, unless otherwise stated. |
|---|---|
2 | The prices of private residential properties are not uniform and vary from project to project. Home-buyers can view more detailed information on transactions of private residential properties at: . Similar information can also be accessed by users on the go via URA’s iphone/ipad application. The application can be downloaded directly from https://itunes.apple.com/app/property-market-information/id573494340?mt=8 (opens in new tab) . |
3 | Projects in the pipeline are new development or redevelopment projects with planning approvals, i.e. Provisional Permission (PP) or Written Permission (WP). |
4 | More detailed data on supply in the pipeline by market segment, development status and expected year of completion can be found at |
5 | These are from awarded GLS sites and Confirmed List sites that have not been awarded yet. |
SUMMARY OF KEY INFORMATION FOR 4TH QUARTER 2021
Table caption
Annex | Title |
|---|---|
Annex A-1a [PDF, 7 KB] (opens in new tab)
| Comparison of Property Price Index for 3rd Quarter 2021 and 4th Quarter 2021 |
Annex A-1b [PDF, 7 KB] (opens in new tab)
| Comparison of Property Price Index for 2020 and 2021 |
Annex A-2 [PDF, 9 KB] (opens in new tab)
| Price Indices of Non-Landed Properties by Market Segment |
Annex A-3a [PDF, 8 KB] (opens in new tab)
| Comparison of Rental Index for 3rd Quarter 2021 and 4th Quarter 2021 |
Annex A-3b [PDF, 8 KB] (opens in new tab)
| Comparison of Rental Index for 2020 and 2021 |
Annex A-4 [PDF, 10 KB] (opens in new tab)
| Rental Indices of Non-Landed Properties by Market Segment |
Annex A-5 [PDF, 72 KB] (opens in new tab)
| Median Rentals and Vacancy of Office and Retail Space |
Annex A-6 [PDF, 15 KB] (opens in new tab)
| Chart of Property Price Index by Type of Property |
Annex A-7 [PDF, 10 KB] (opens in new tab)
| Chart of Residential Property Price Index by Type |
Annex B-1 [PDF, 7 KB] (opens in new tab)
| Number of Unsold Private Residential Units from Projects with Planning Approvals |
Annex B-2 [PDF, 10 KB] (opens in new tab)
| Number of Unsold Private Residential Units from Projects with Planning Approvals by Market Segment |
Annex C-1 [PDF, 10 KB] (opens in new tab)
| Number of Uncompleted Private Residential Units Launched in the Quarter by Market Segment |
Annex C-2 [PDF, 63 KB] (opens in new tab)
| Number of Private Residential Units Sold in the Quarter by Market Segment |
Annex D [PDF, 78 KB] (opens in new tab)
| Number of New Sale, Sub-Sale and Resale Transactions for Private Residential Units by Market Segment |
Annex E-1 [PDF, 58 KB] (opens in new tab)
| Stock & Vacancy and Supply in the Pipeline as at End of 4th Quarter 2021 |
Annex E-2 [PDF, 66 KB] (opens in new tab)
| Supply in the Pipeline by Development Status and Expected Year of Completion as at End of 4th Quarter 2021 |
Annex E-3 [PDF, 27 KB] (opens in new tab)
| Pipeline Supply of Private Residential Units and Executive Condominiums by Expected Year of Completion as at End of 4th Quarter 2021 |
Annex E-4 [PDF, 9 KB] (opens in new tab)
| Vacancy of Private Residential Units by Market Segment |
Annex F [PDF, 69 KB] (opens in new tab)
| Number of Executive Condominium Units Launched and Sold in the Quarter |