
A Cool City in a Warming World
Discover how Singapore is incorporating climate-sensitive urban design strategies and urban climate modelling to ensure the city remains liveable in the face of rising heat.
Last updated 4 June 2026
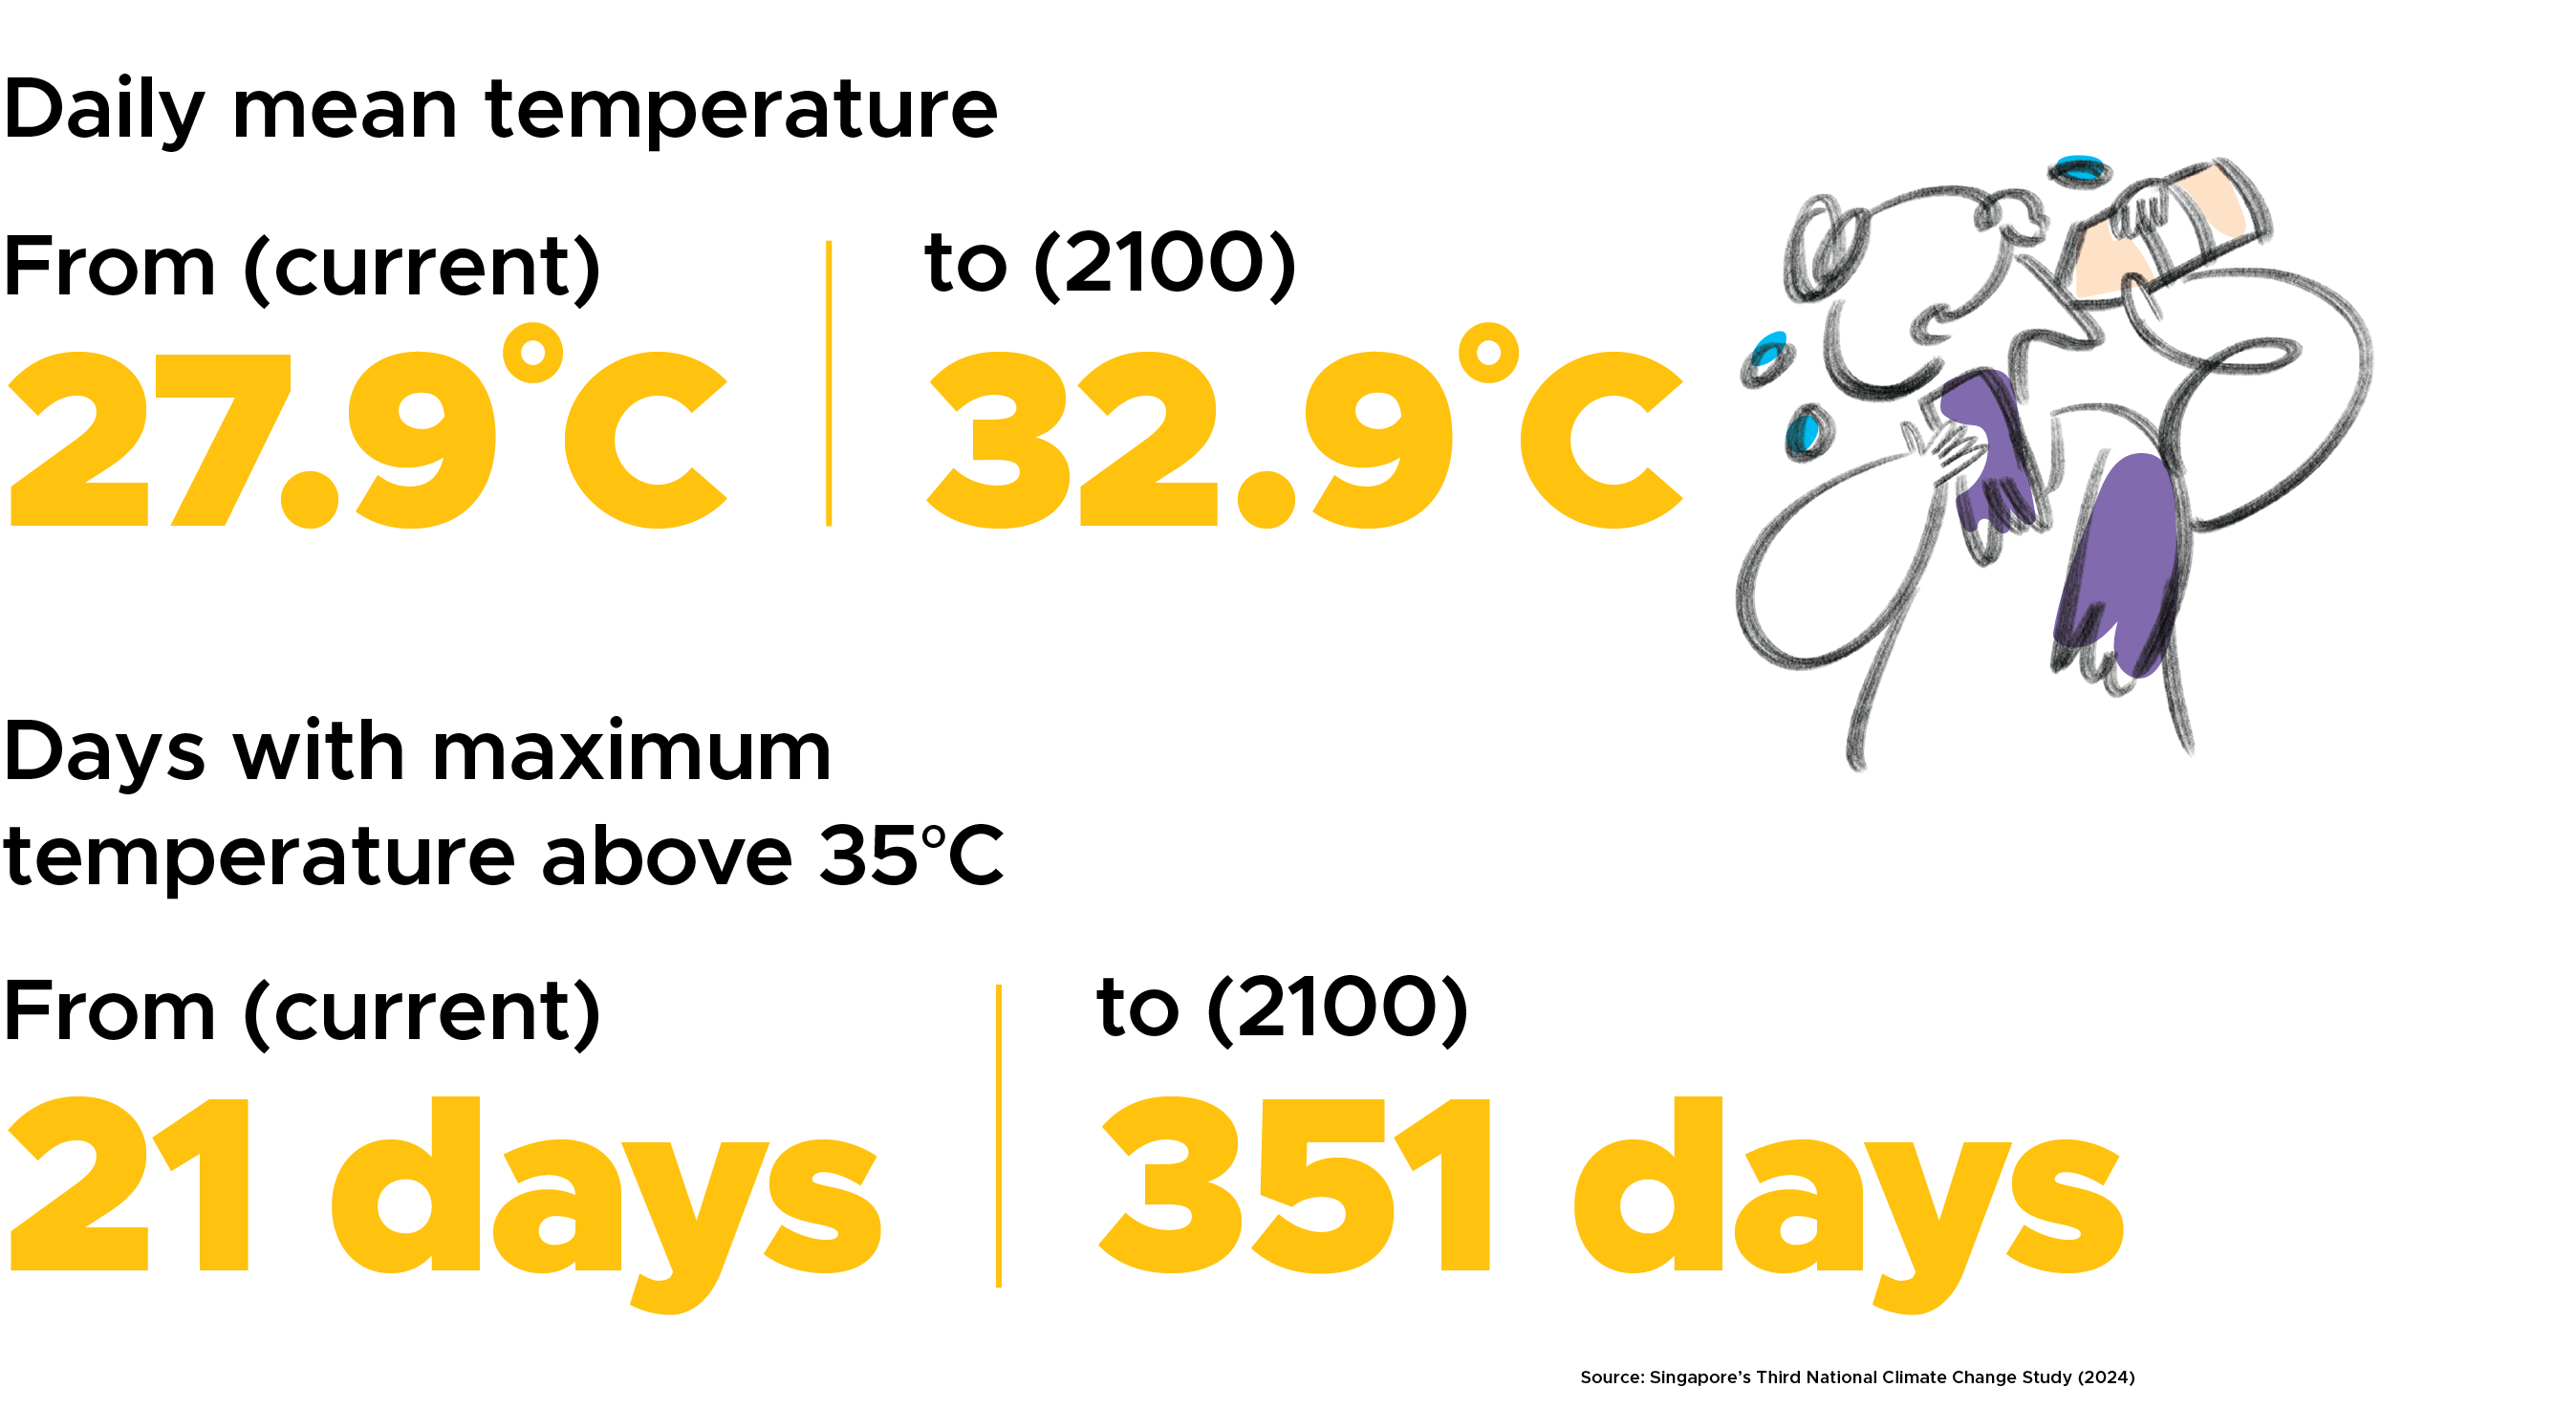
By 2100, high heat-stress days will be the norm for most of the year. Planning for heat response and mitigation is crucial to ensure that Singapore remains liveable. A three-pronged strategy is adopted to achieve this:
Implementing cooling strategies.
Strengthening the community’s heat resilience.
Deepening our scientific understanding of heat.
Under the worst-case scenario with high emissions,
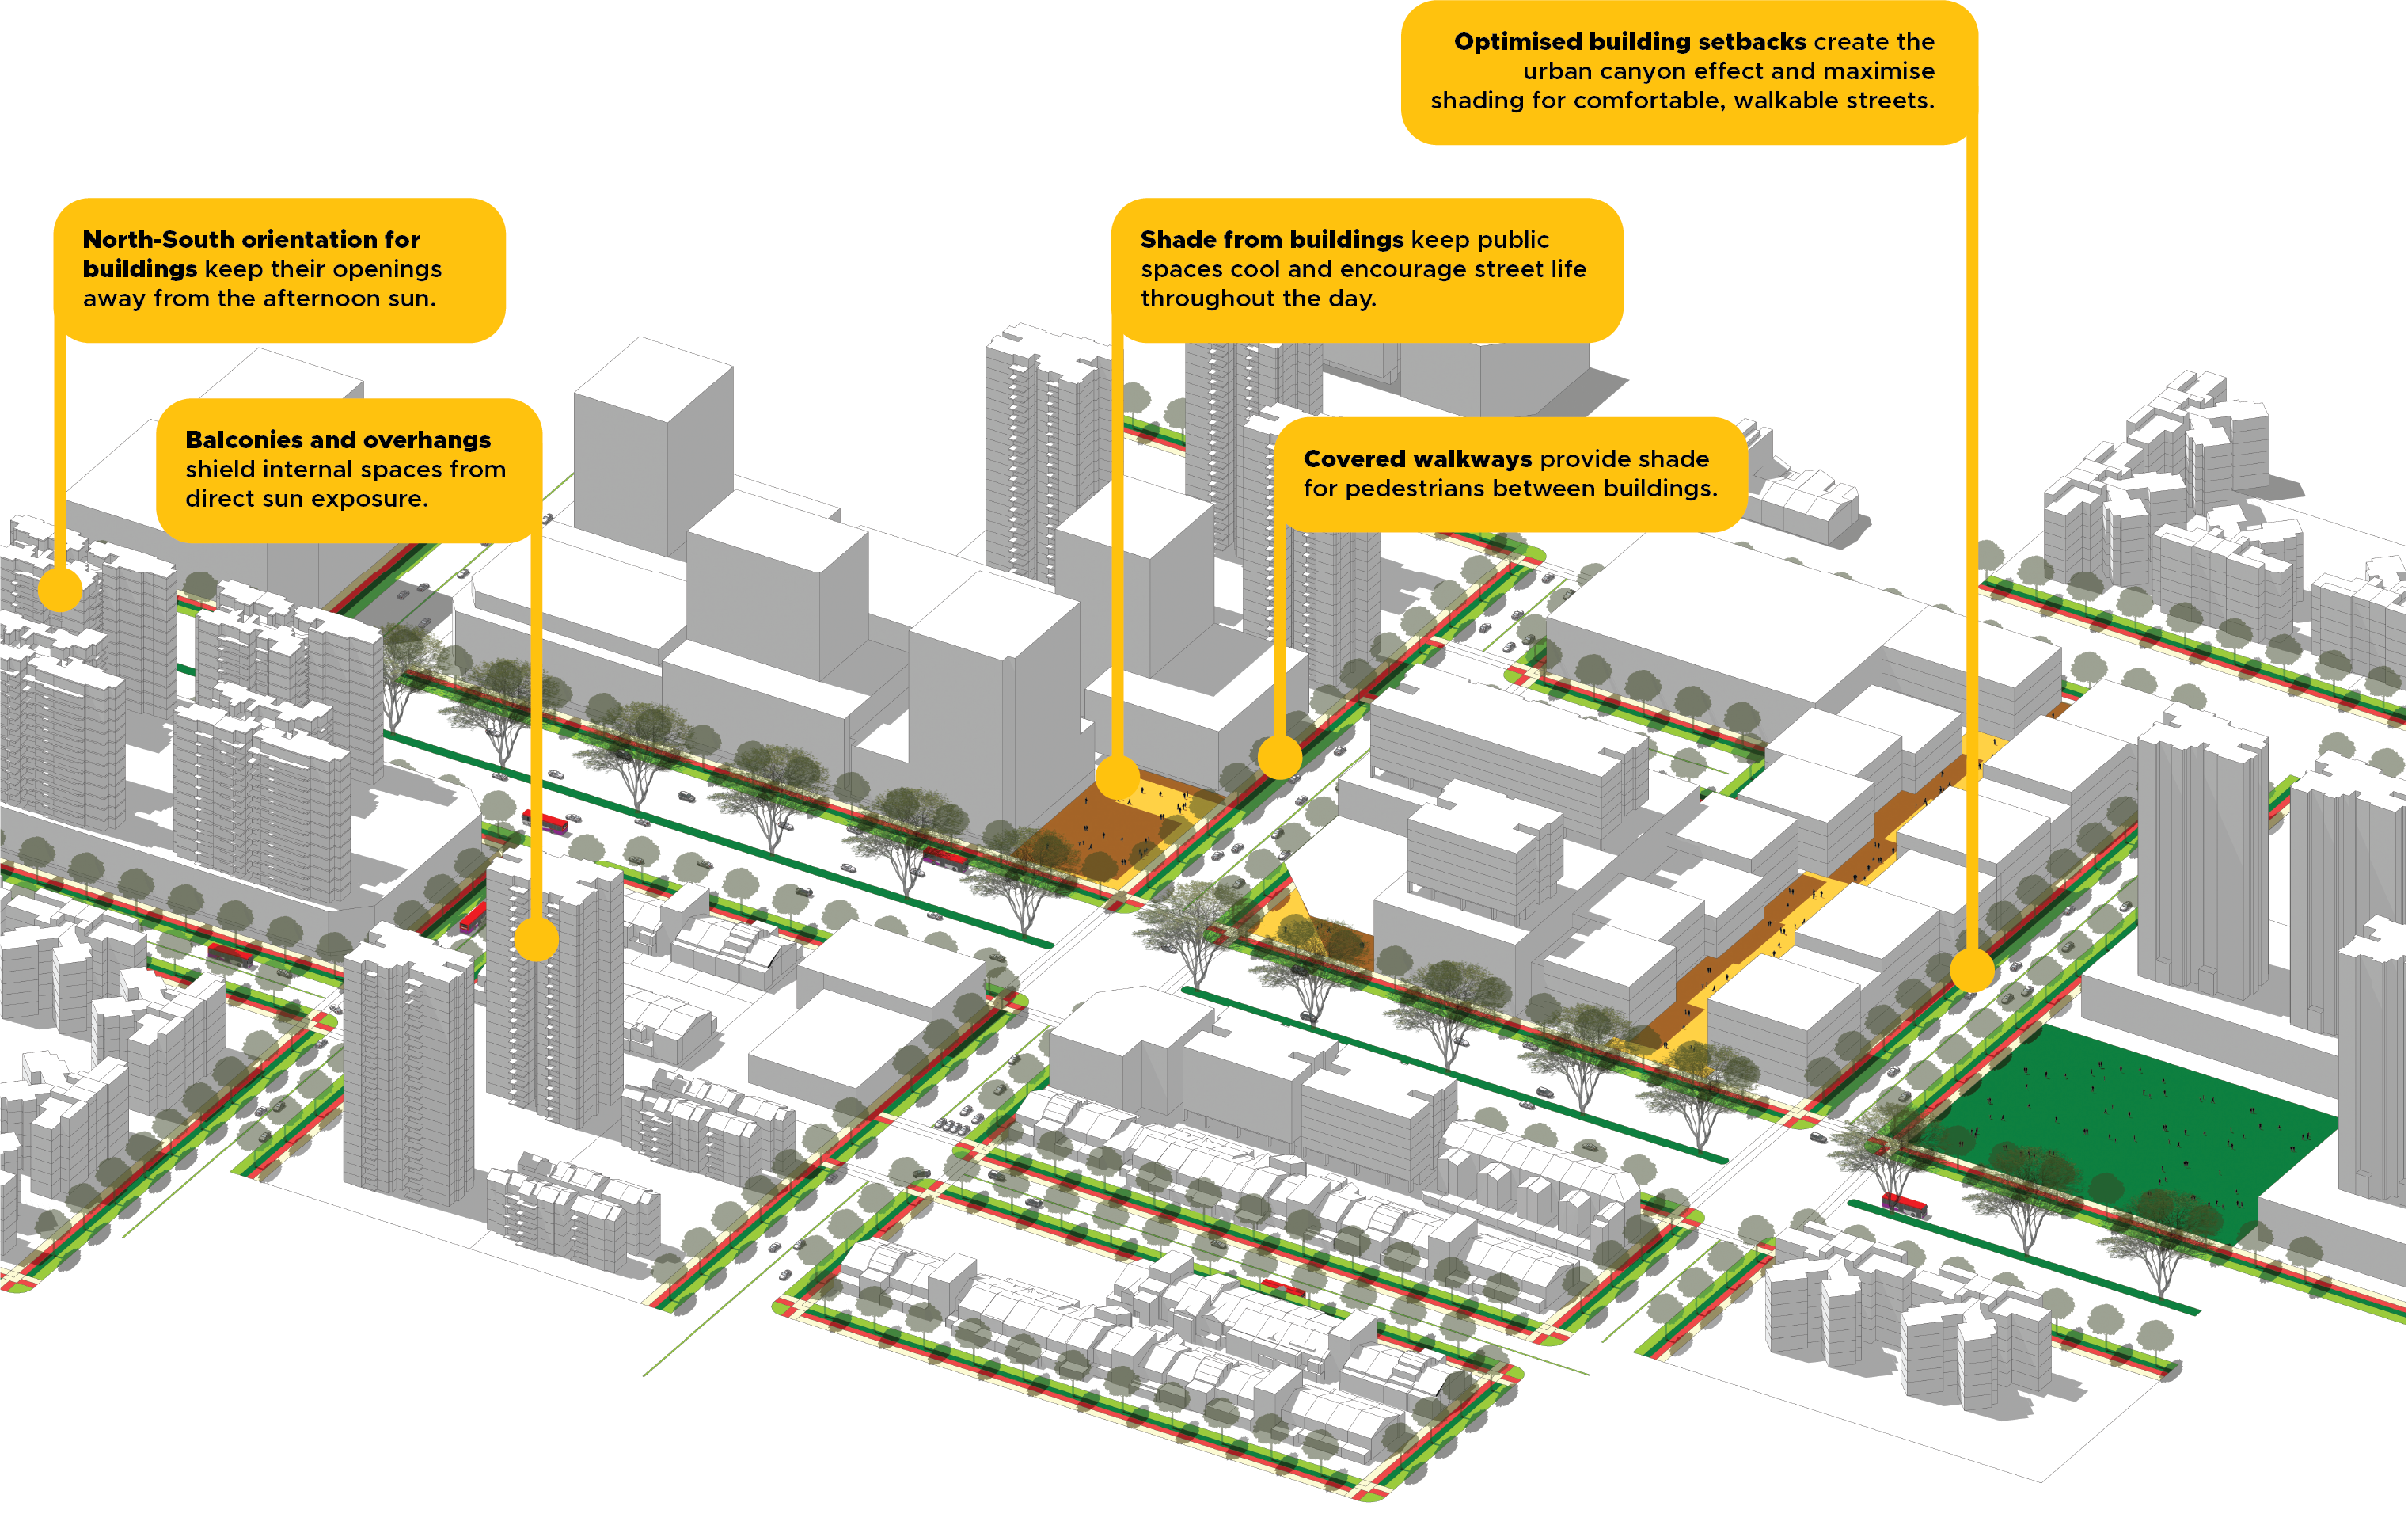
Implementing climate-sensitive urban design
Various urban design strategies have been introduced across the city to create a cooler environment.
Green and cool
Greenery in our urban landscape reduces the effects of heat whilst providing beautiful spaces for recreation and supporting biodiversity.
_hi-res.png)
Orchard Road: Spot readings demonstrate the cooling effect of the landscaping.
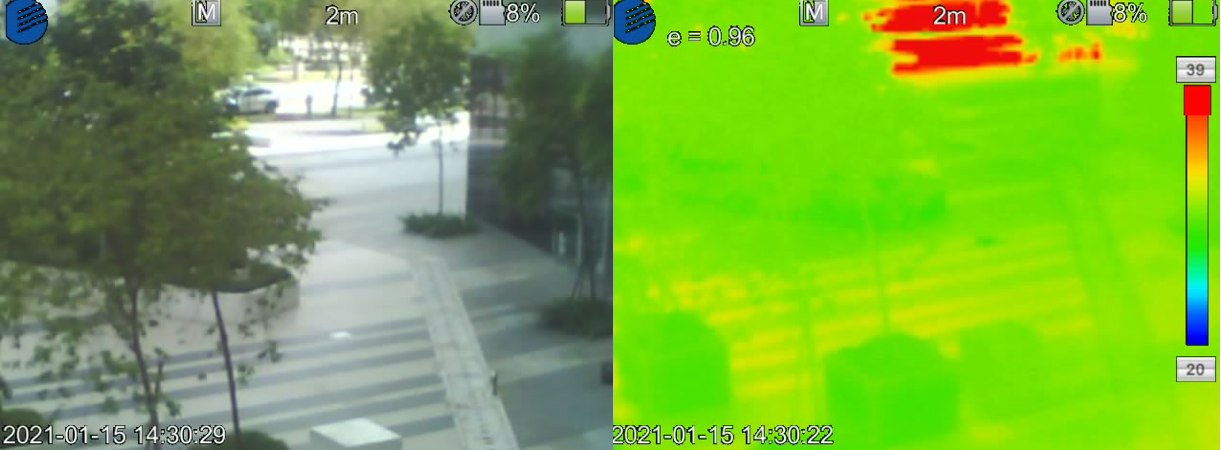
_hi-res.png)
Paya Lebar Quarter: Thermal analysis shows that lush planting lowers temperatures by 8 to 9°C in unshaded areas.
Fusionopolis: Based on thermal analysis, planting lowers temperatures by 1 to 2°C in shaded areas.
Maximising wind flow
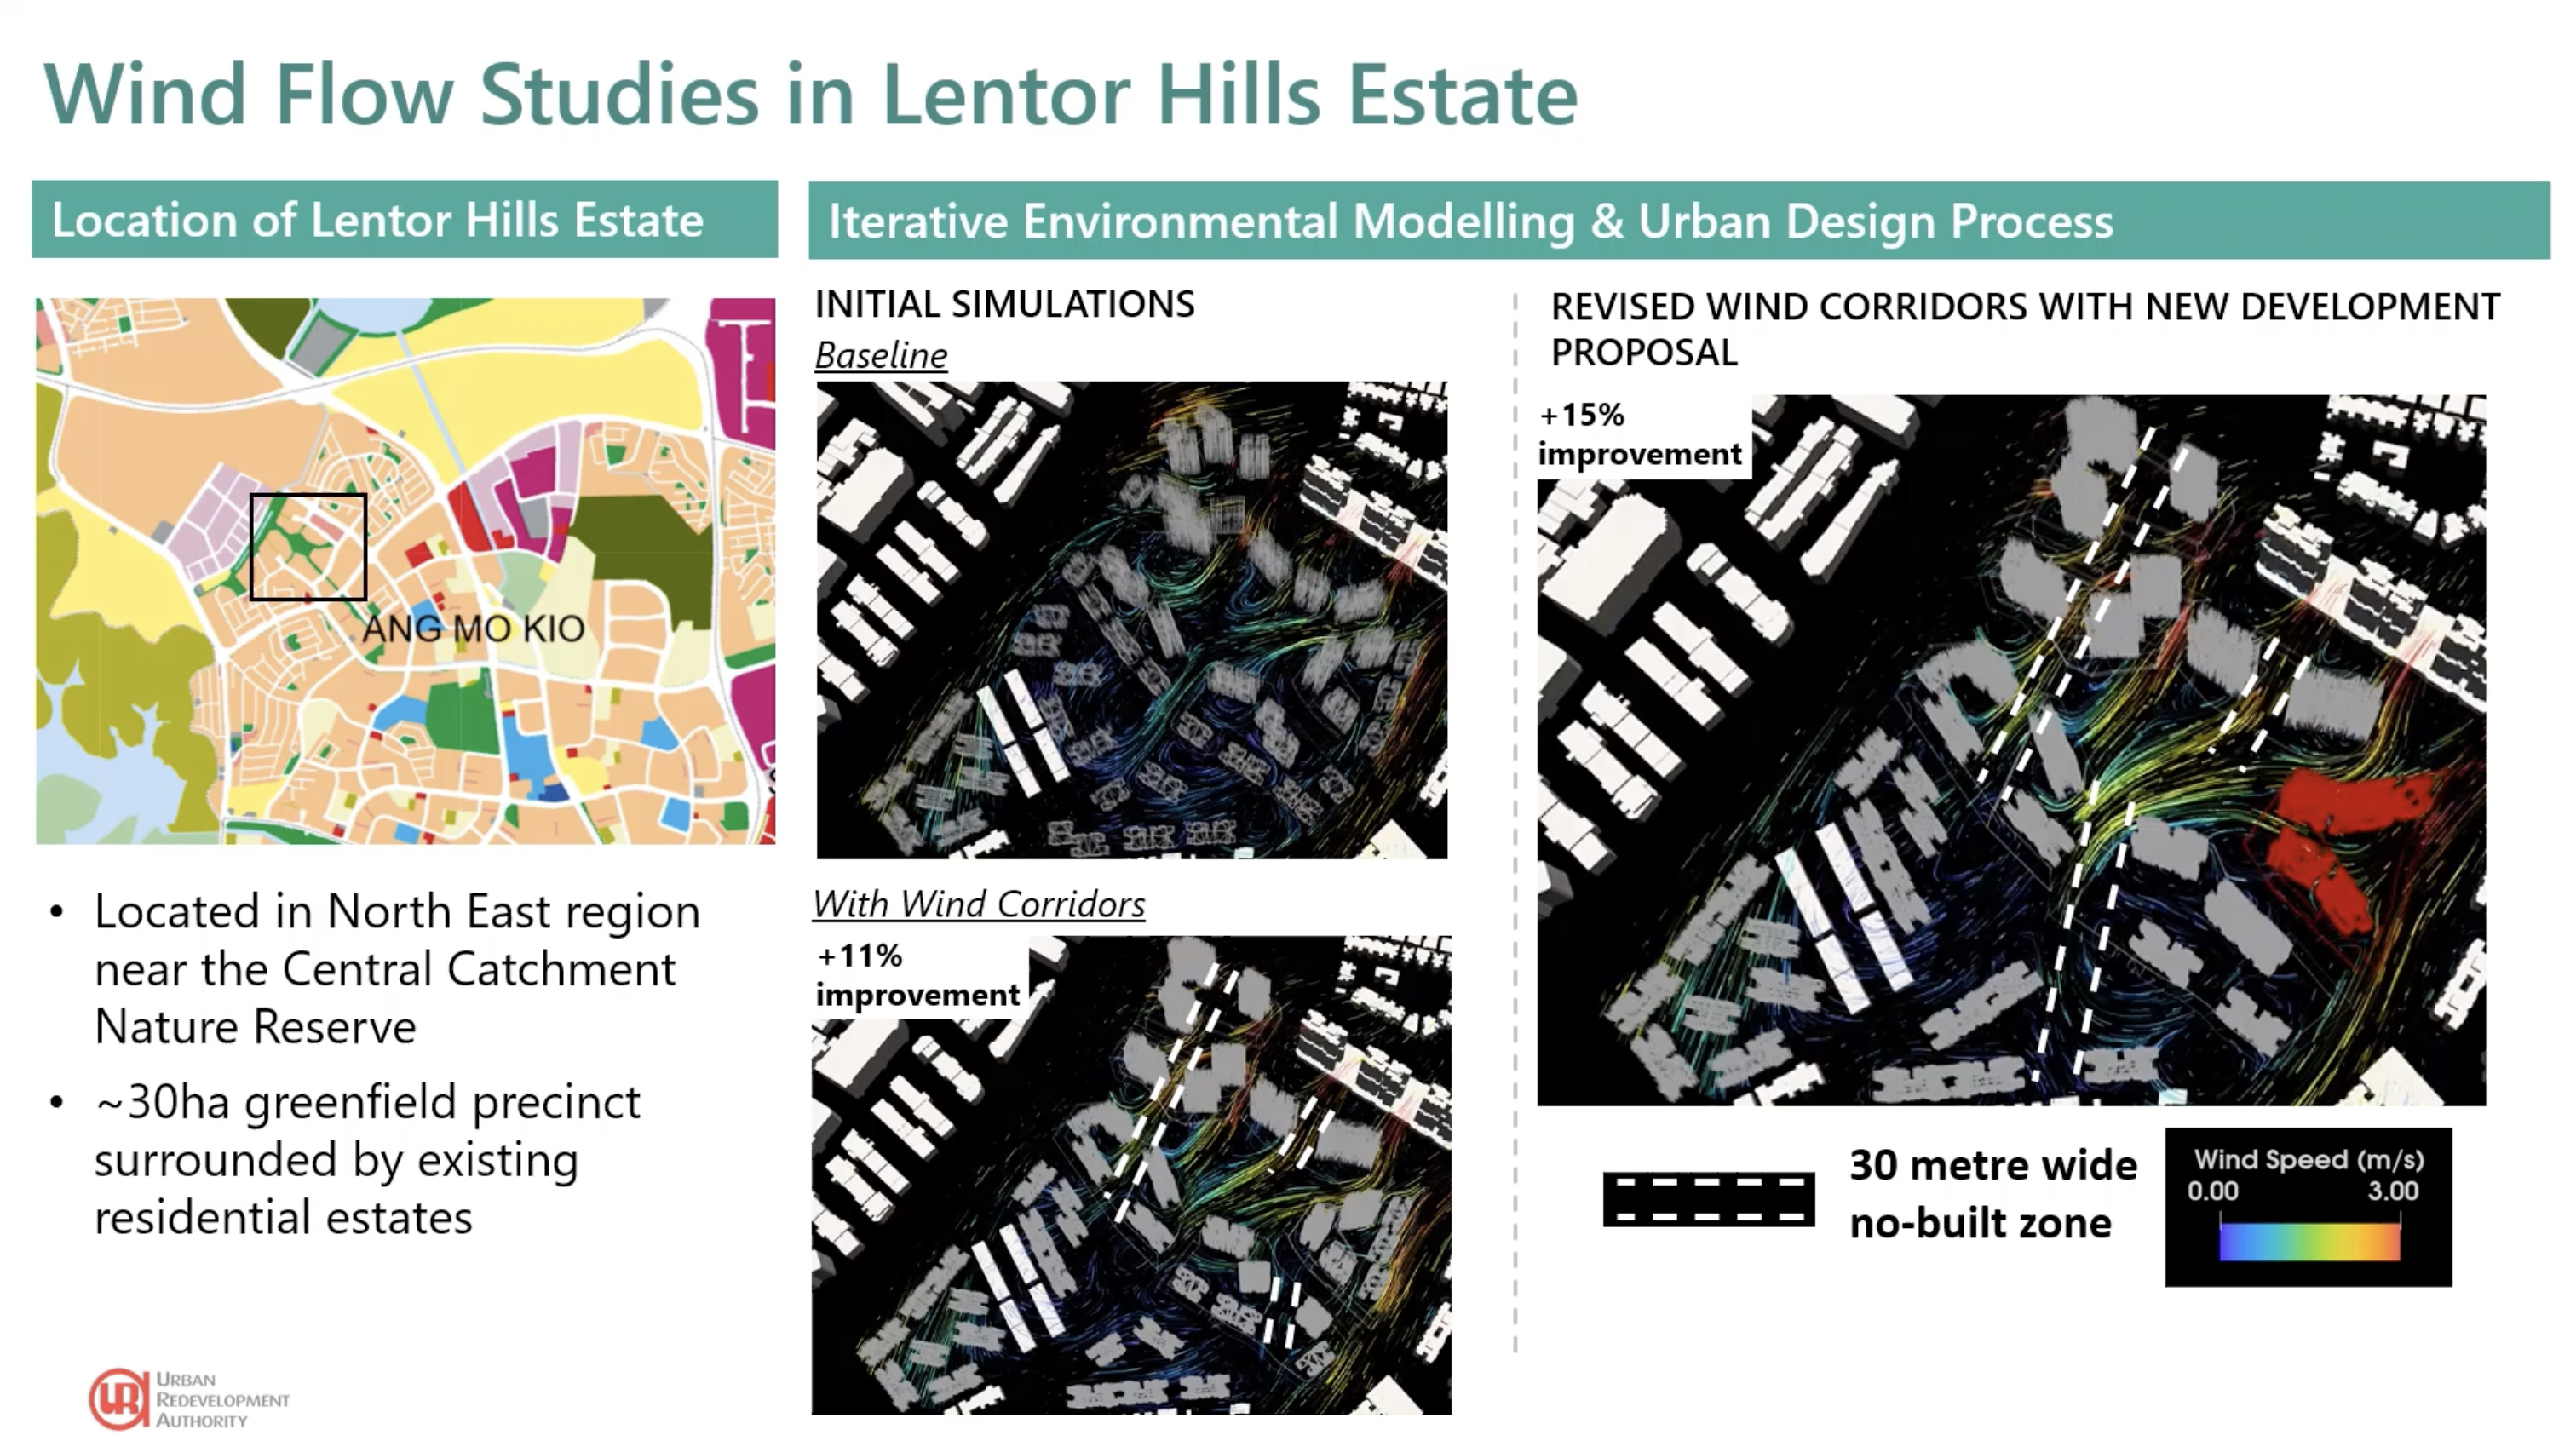
Environmental modelling capabilities are part of Singapore’s planning process to cater for wind flow and ventilation at the building and precinct levels. In selected areas, wind analyses were used to optimise spacing and porosity between buildings, vary building heights and safeguard wind corridors.
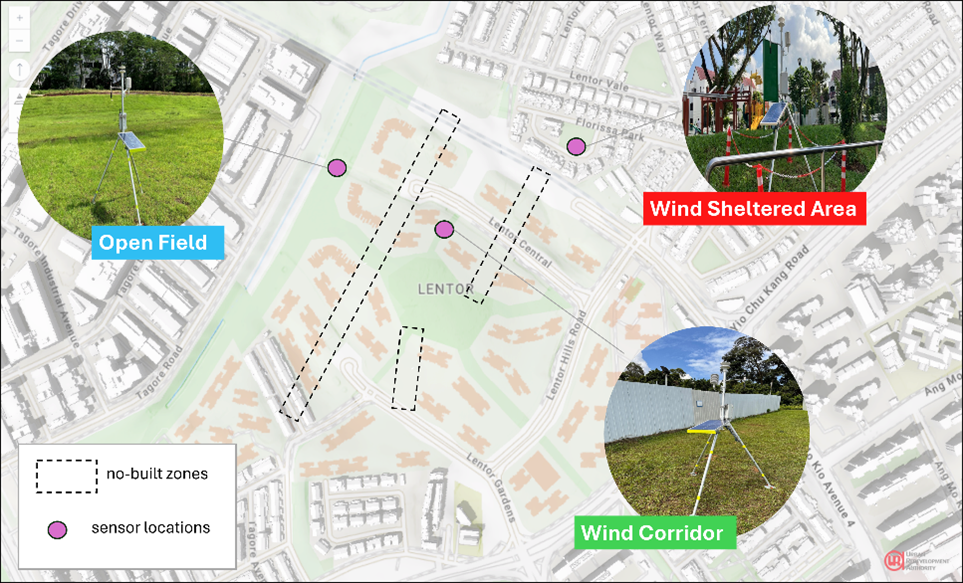
Lentor Hills Estate leveraged on wind flow studies to identify wind corridors which developers must protect. As the estate develops, wind flow simulations are re-run to refine the wind corridors for subsequent sites.
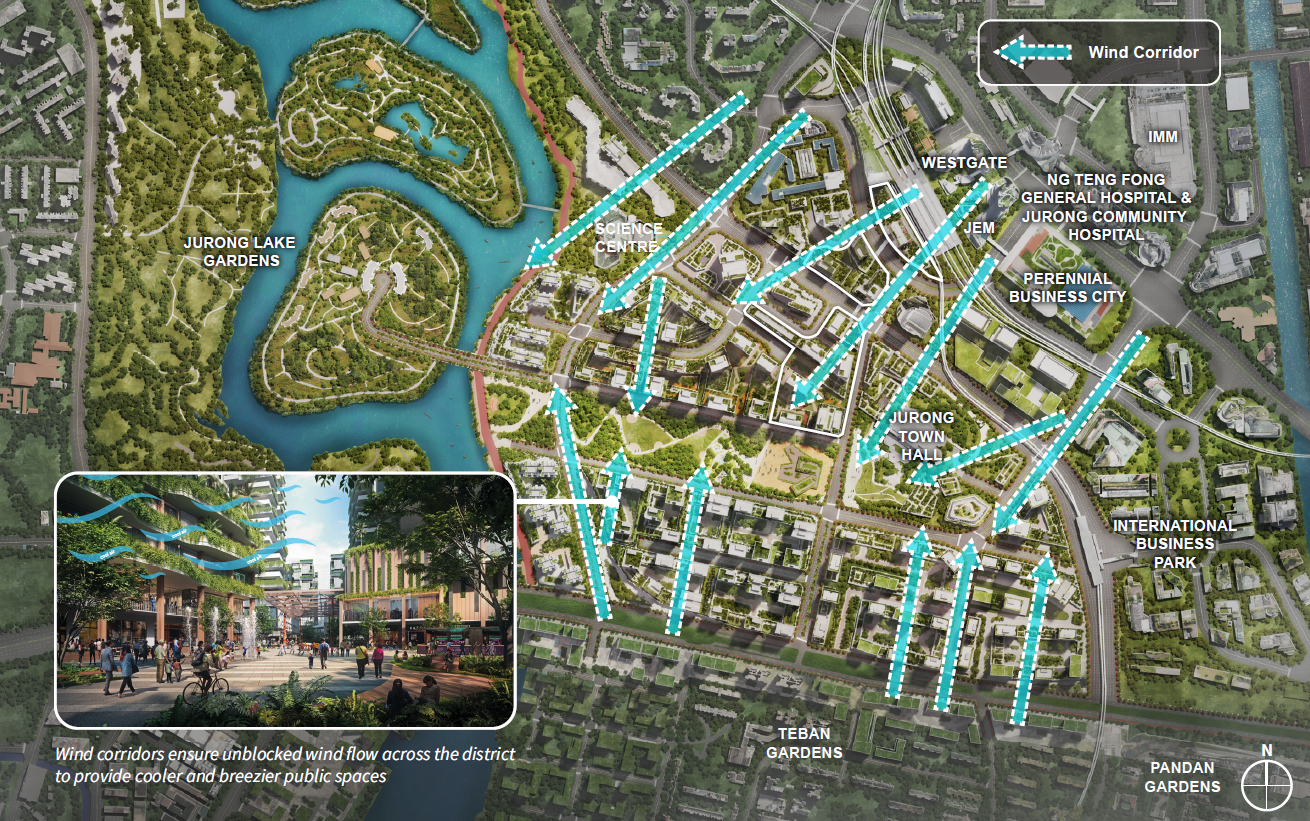
Jurong Lake District is designed to harness prevailing winds to mitigate the urban heat island effect and improve outdoor thermal comfort. Wind corridors along the prevailing wind directions from the north-east and south are safeguarded throughout the district.
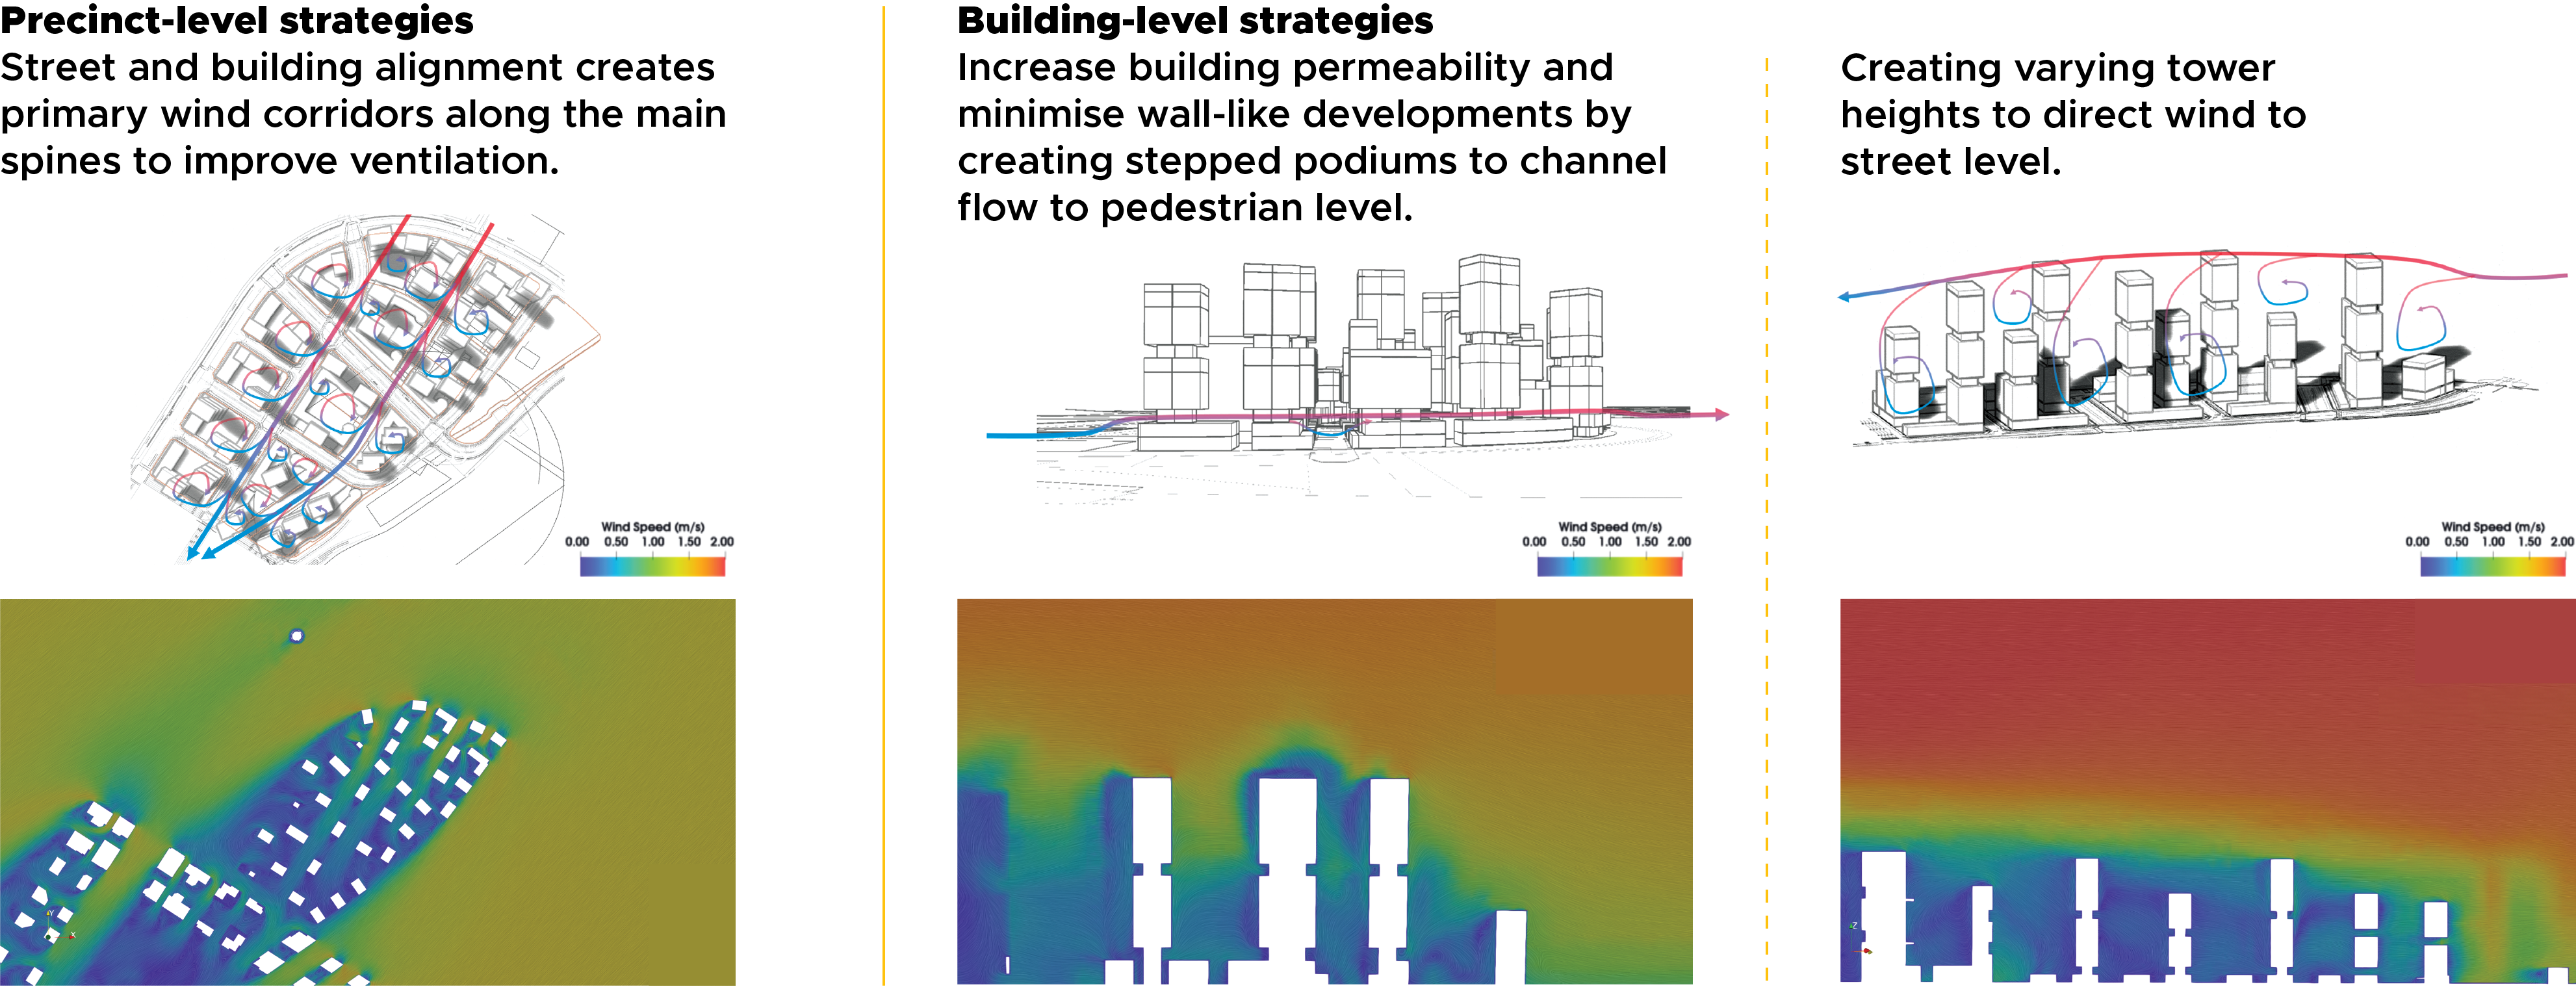
Marina South underwent wind flow studies that informed strategies for optimal wind flows. These included placing towers and various high-, mid- and low-rise zones throughout the precinct to create wind corridors, and channeling wind to key streets, public spaces and residential blocks.
Better sensing with technology
Environmental sensors are deployed in Lentor Hills Estate to study the effectiveness of wind corridors in improving ventilation and lowering temperatures. Preliminary data indicate a positive correlation, with higher wind speeds leading to a cooler ambient environment.
Wind LiDAR, a new sensing technology, is being trialled by Urban Redevelopment Authority (URA) in collaboration with the National University of Singapore (NUS). It collects wind information at different heights using laser technology to analyse the shift of light scattered by air particles. Such data will help agencies improve the robustness of wind flow simulations.
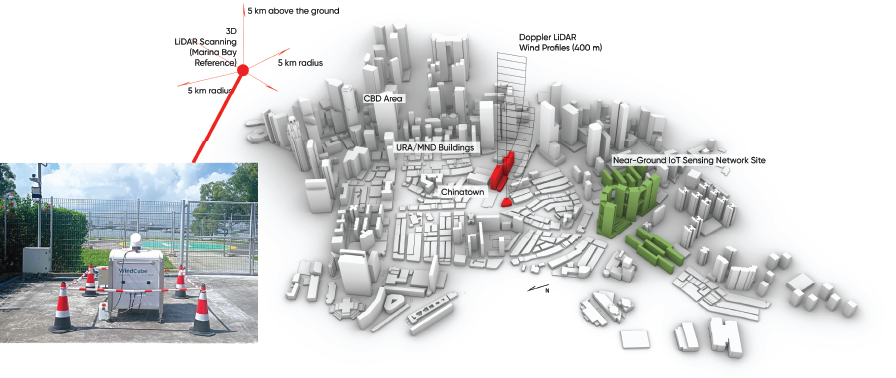
Source: National University of Singapore
Minimising sun exposure
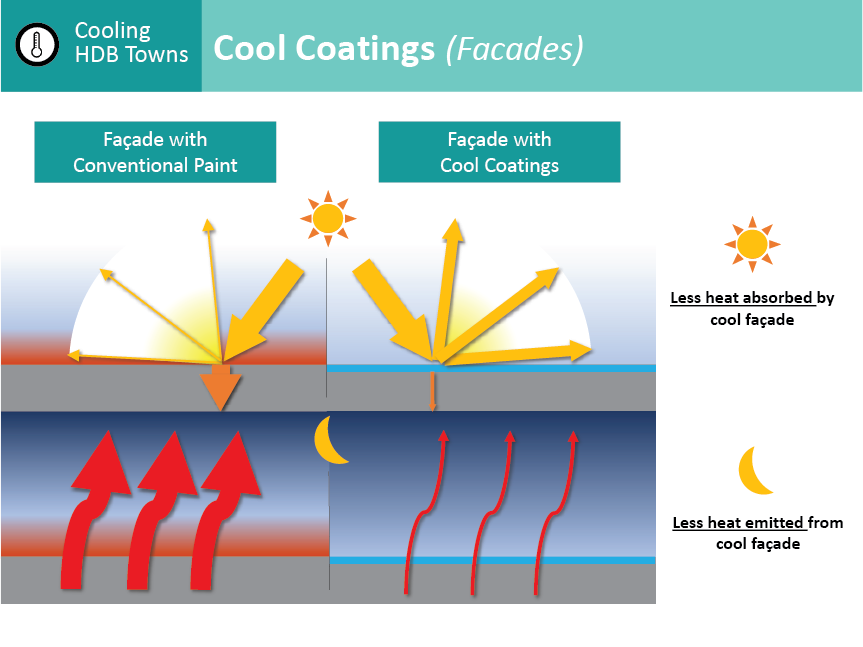
Colour your world cool
Cool coatings can be used to cool the urban environment. It is a type of specialised paint containing additives that reflect the sun’s heat, reducing surface heat absorption and emission.
The Housing & Development Board (HDB) carried out a joint pilot trial with Tampines Town Council on the use of cool coatings on ~130 HDB blocks in Tampines under its Green Towns Programme (GTP). The trial showed a reduction of ambient temperatures by up to 2 °C! Following the successful pilot, HDB will extend the cool coatings initiative to all existing HDB estates by 2030.
Source: HDB
Understanding heat through technology
Various digital tools have been developed through collaborations between government agencies and Institutes of Higher Learning to improve thermal comfort in Singapore:
Source: Singapore University of Technology and Design
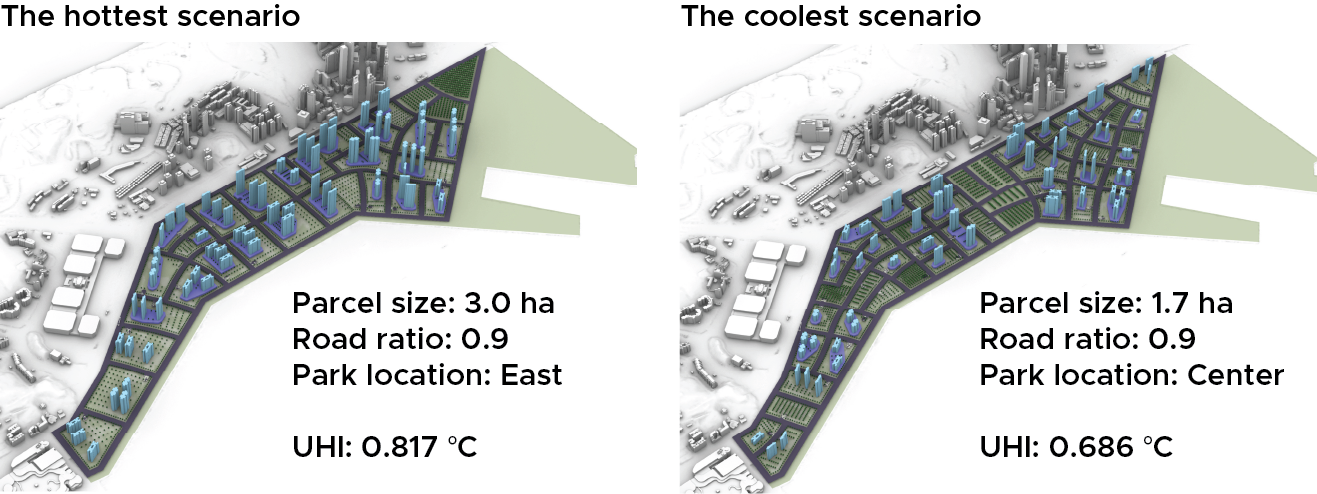
URA and the Adaptive Design Lab at the Singapore University of Technology and Design are developing a computational model to generate multiple planning scenarios for evaluating urban heat performance. It will help planners make more informed decisions and navigate trade-offs when developing cooler neighbourhoods.
.png)
Source: HDB
Integrated Environmental Modeller (IEM) was jointly developed by the HDB and the Agency for Science, Technology and Research (A*STAR). Planners and architects can use the high-resolution 3D city models to simulate environmental factors such as wind flow, solar irradiance and temperatures to optimise the placement of HDB blocks for comfort and sustainability.
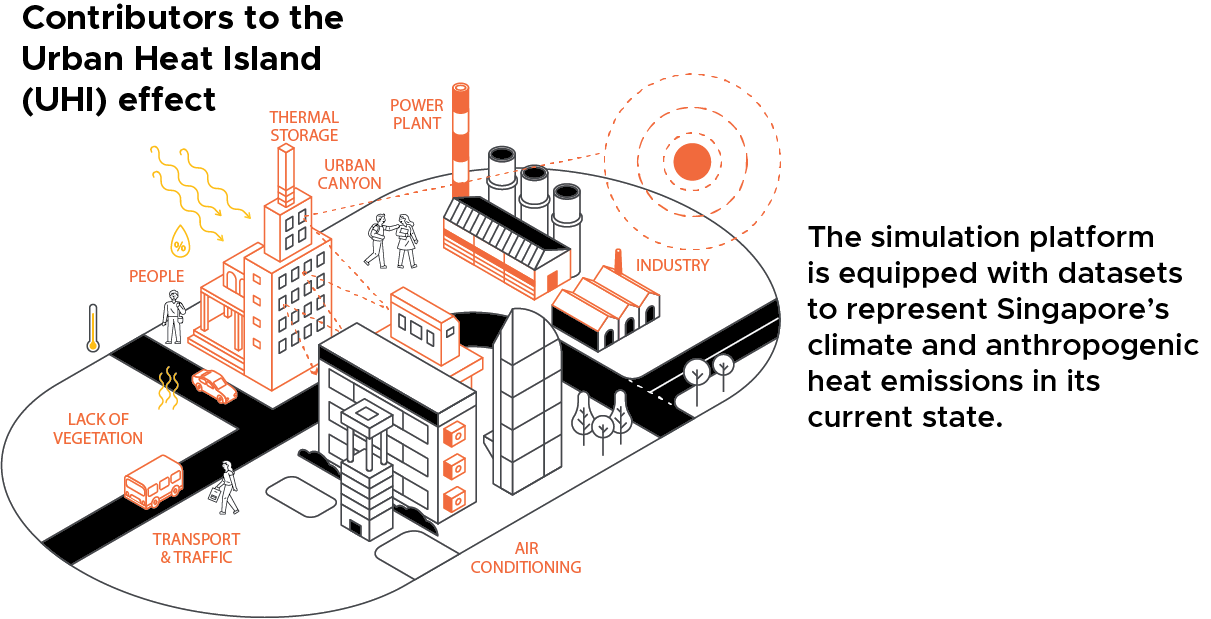
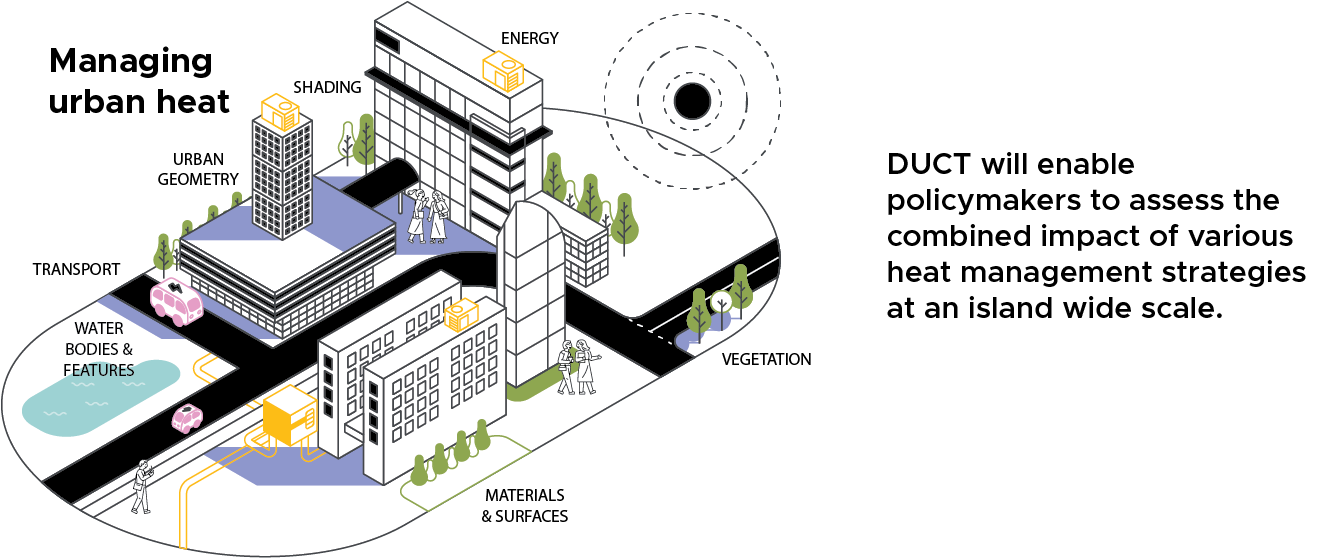
Digital Urban Climate Twin (DUCT) integrates computational models of relevant urban elements and urban climate models to simulate Singapore’s urban climate and anthropogenic heat emissions.
Source: Singapore-ETH Centre
Source: Singapore-ETH Centre
Stay cool!
With the Heat Stress Advisory on the myENV app, you can reduce the risk of heat stress and heat-related illnesses during prolonged outdoor activities!
Download myENV app to beat the heat!