
Press Releases
Release of 1st Quarter 2023 Real Estate Statistics
28 April 2023
• Close to 3,800 private residential units (including ECs) were completed in 1st Quarter 20231, 60% more than the average of around 2,400 units completed per quarter in 2022. With the large supply completion, the vacancy rate for private residential properties rose to a five-quarter high of 6.0 per cent in 1st Quarter 2023, from 5.5 per cent in the preceding quarter.
• For the whole of 2023, a total of around 19,000 units are expected to be completed, the highest annual supply completion since 2017. The cumulative total of around 40,400 private residential units (including ECs) to be completed between 2023 and 2025 will form part of the total supply of 100,000 public and private housing units to be completed over the three-year period.
• The Government has further ramped up the supply of private housing on the Confirmed List for the GLS Programme to 4,090 units in the 1st half of 2023 from 3,505 units in the 2nd half of 2022, to cater to demand. The Government will maintain a steady GLS supply pipeline to meet growing housing demand.
• The ramp up in housing supply complements the increases in Additional Buyer’s Stamp Duty (ABSD) rates on 27 Apr 2023, which were implemented to pre-emptively manage local and foreign investment housing demand and prioritise housing for locals buying for owner-occupation.
• The Government will continue to monitor the property market closely, and will adjust its policies as necessary to promote a stable and sustainable property market.
The Urban Redevelopment Authority (URA) released today the real estate statistics for 1st Quarter 2023.
PRIVATE RESIDENTIAL PROPERTIES
Private residential market at a glance:
Prices and Rentals
Prices of private residential properties increased by 3.3% in 1st Quarter 2023, compared with the 0.4% increase in the previous quarter.
Property Price Index of private residential properties
Prices of landed properties increased by 5.9% in 1st Quarter 2023, compared with the 0.6% increase in the previous quarter. Prices of non-landed properties increased by 2.6% in 1st Quarter 2023, compared with the 0.3% increase in the previous quarter.
Prices of non-landed properties in Core Central Region (CCR) increased by 0.8% in 1st Quarter 2023, compared with the 0.7% increase in the previous quarter. Prices of non-landed properties in Rest of Central Region (RCR) increased by 4.4%, compared with the 3.1% increase in the previous quarter. Prices of non-landed properties in Outside Central Region (OCR) increased by 1.9%, compared with the 2.6% decrease in the previous quarter (see Annexes A-1 [PDF, 8 KB], A-2 [PDF, 9 KB] & A-6 [PDF, 16 KB]2).
Rentals of private residential properties increased by 7.2% in 1st Quarter 2023, a marginal moderation from the 7.4% increase in the previous quarter.
Rental Index of private residential properties
The increase in the rentals of non-landed properties moderated to 6.2%, from the 7.5% increase in the previous quarter. Rentals of landed properties increased by 14.5% in 1st Quarter 2023, compared with the 6.3% increase in the previous quarter.
Rentals of non-landed properties in CCR saw an increase of 6.4% in 1st Quarter 2023, compared with the 7.3% increase in the previous quarter. Similarly, rentals in RCR increased by 6.2%, compared with the 7.3% increase in the previous quarter. Rentals in OCR increased by 6.1%, compared with the 8.2% increase in the previous quarter (see Annexes A-3 [PDF, 8 KB] & A-4 [PDF, 10 KB]).
Launches and Take-up
Developers launched 1,312 uncompleted private residential units (excluding ECs) for sale in 1st Quarter 2023, compared with the 504 units in the previous quarter (see Annex C-1 [PDF, 10 KB]).
Developers sold 1,256 private residential units (excluding ECs) in 1st Quarter 2023, compared with the 690 units sold in the previous quarter (see Annex D [PDF, 76 KB]).
Number of private housing units launched and sold by developers (excluding ECs)
Developers did not launch any EC units for sale in 1st Quarter 2023 and sold 206 EC units in the quarter (see Annex F [PDF, 69 KB]). In comparison, developers launched 1,257 EC units for sale and sold 1,127 EC units in the previous quarter.
Resales and Sub-sales
There were 2,622 resale transactions in 1st Quarter 2023, compared with the 2,694 units transacted in the previous quarter. Resale transactions accounted for 63.6% of all sale transactions in 1st Quarter 2023, compared with 75.1% in the previous quarter (see Annex D [PDF, 76 KB]).
There were 243 sub-sale transactions in 1st Quarter 2023, compared with the 204 units transacted in the previous quarter. Sub-sales accounted for 5.9% of all sale transactions in 1st Quarter 2023, compared with 5.7% in the previous quarter (see Annex D [PDF, 76 KB]).
Number of resale and sub-sale transactions for private residential units (excluding ECs)
Supply Completions
A total of 3,785 private residential units (including ECs) were completed in 1st Quarter 2023, compared to the 4,423 units completed in the preceding quarter. The number of units completed in 1st Quarter 2023 was around 60% more than the average of around 2,400 units completed per quarter in 2022. Projects completed in the quarter include Avenue South Residence (988 units), Piermont Grand (820 units), Kent Ridge Hill Residences (548 units) and Riviere (455 units) (see Annexes E-4 [PDF, 8 KB] & E-5 [PDF, 28 KB]).
Supply in the Pipeline
As at the end of 1st Quarter 2023, there was a total supply of 44,846 uncompleted private residential units (excluding ECs) in the pipeline with planning approvals3, compared with the 46,041 units in the previous quarter (see Annexes E-1 [PDF, 59 KB] & E-2 [PDF, 66 KB]4). Of this number, 16,252 units remained unsold as at the end of 1st Quarter 2023, compared with the 16,024 units in the previous quarter (see Annexes B-1 [PDF, 7 KB] & B-2 [PDF, 10 KB]).
After adding the supply of 5,398 EC units in the pipeline, there were 50,244 units in the pipeline with planning approvals (see Annex E-3 [PDF, 30 KB]). Of the EC units in the pipeline, 1,291 units remained unsold. In total, 17,543 units with planning approvals (including ECs) remained unsold.
Total number of unsold private residential units in the pipeline
Based on the expected completion dates reported by developers, 15,221 units (including ECs) will be completed in the remaining 3 quarters of 2023. Another 21,421 units (including ECs) are expected to be completed in 2024 and 2025. In total, around 40,400 units (including ECs) are expected to be completed between 2023 and 2025, which is around twice the 20,000 units completed from 2020 to 20225. This forms part of the total supply of about 100,000 public and private housing units to be completed between 2023 and 2025, which will help to cater to housing needs in the immediate few years ahead.
Pipeline supply of private residential units and ECs by expected year of completion
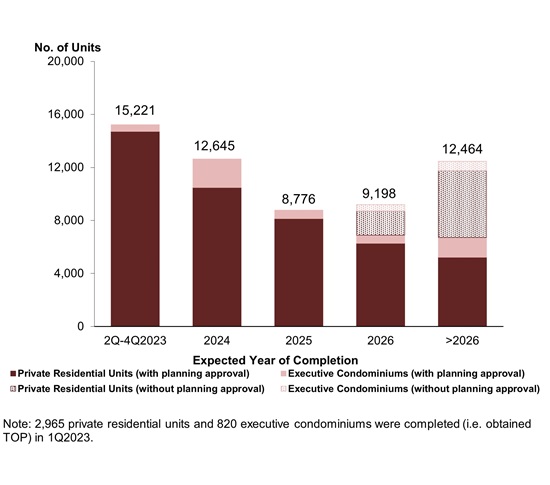
Adding the supply of unsold units (including ECs) in the supply pipeline with planning approval, and those that have not been granted planning approval yet, around 25,600 units (including ECs) could be made available for sale later this year or next year. The Government has further ramped up the supply of private housing on the Confirmed List for the GLS Programme in 1st half of 2023 to cater to demand6.
The ramp-up in housing supply complements the increases to the ABSD rates, which took effect on 27 April 2023. The Government increased the ABSD rates for SCs and PRs purchasing their second and subsequent residential property, and foreigners, entities and trustees purchasing any residential property (except housing developers)7. These increases are to pre-emptively dampen the robust local and foreign investment demand to promote a more sustainable property market. The Government’s priority is to support Singaporeans who need to buy residential property for owner-occupation.
The Government will continue to adjust its policies as necessary so that they remain relevant and calibrate housing supply, to promote a stable and sustainable property market.
Stock and Vacancy
The stock of completed private residential units (excluding ECs) increased by 2,864 units in 1st Quarter 2023, compared with the increase of 4,245 units in the previous quarter. The stock of occupied private residential units (excluding ECs) increased by 887 units in 1st Quarter 2023, compared with the increase of 4,496 units in the previous quarter. As a result, the vacancy rate of completed private residential units (excluding ECs) increased to 6.0% as at the end of 1st Quarter 2023, from 5.5% in the previous quarter (see Annex E-1 [PDF, 59 KB]).
Stock and vacancy of private residential units (excluding ECs)
Vacancy rates of completed private residential properties as at the end of 1st Quarter 2023 in CCR, RCR and OCR were 7.7%, 9.2%, and 3.3% respectively, compared with the 6.9%, 7.9% and 3.6% in the previous quarter (see Annex E-6 [PDF, 9 KB]).
OFFICE SPACE
Office market at a glance:
Prices and Rentals
Prices of office space remained the same in 1st Quarter 2023, compared with the 3.7% increase in the previous quarter (see Annex A-1 [PDF, 8 KB]). Rentals of office space increased by 5.1% in 1st Quarter 2023, same as the increase in the previous quarter (see Annexes A-3 [PDF, 8 KB] & A-5 [PDF, 73 KB]).
Property Price Index of office space in Central Region
Rental Index of office space in Central Region
Supply in the Pipeline
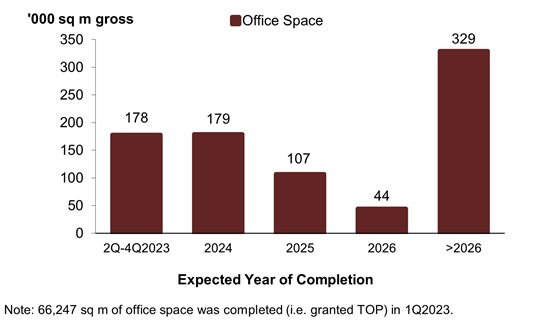
As at the end of 1st Quarter 2023, there was a total supply of about 837,000 sq m GFA of office space in the pipeline, compared with the 872,000 sq m GFA of office space in the pipeline in the previous quarter (see Annexes E-1 [PDF, 59 KB] & E-2 [PDF, 66 KB]).
Pipeline supply of office space
Stock and Vacancy
The amount of occupied office space increased by 21,000 sq m (nett) in 1st Quarter 2023, compared with the increase of 9,000 sq m (nett) in the previous quarter. The stock of office space increased by 14,000 sq m (nett) in 1st Quarter 2023, compared with the decrease of 23,000 sq m (nett) in the previous quarter. As a result, the island-wide vacancy rate of office space decreased to 11.2% as at the end of 1st Quarter 2023, from 11.3% as at the end of the previous quarter (see Annexes A-5 [PDF, 73 KB] & E-1 [PDF, 59 KB]).
Stock and vacancy of office space
RETAIL SPACE
Retail market at a glance:
Prices and Rentals
Prices of retail space decreased by 0.9% in 1st Quarter 2023, compared with the 2.1% decrease in the previous quarter (see Annex A-1 [PDF, 8 KB]). Rentals of retail space decreased by 0.3% in 1st Quarter 2023, compared with the 1.1% decrease in the previous quarter (see Annexes A-3 [PDF, 8 KB] & A-5 [PDF, 73 KB]).
Property Price Index of retail space in Central Region
Rental Index of retail space in Central Region
Supply in the Pipeline
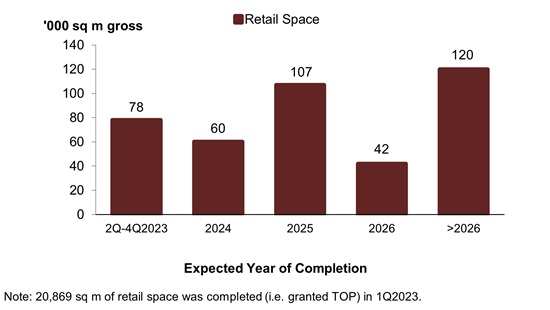
As at the end of 1st Quarter 2023, there was a total supply of 407,000 sq m GFA of retail space from projects in the pipeline, compared with the 420,000 sq m GFA of retail space in the pipeline in the previous quarter (see Annexes E-1 [PDF, 59 KB] & E-2 [PDF, 66 KB]).
Pipeline supply of retail space
Stock and Vacancy
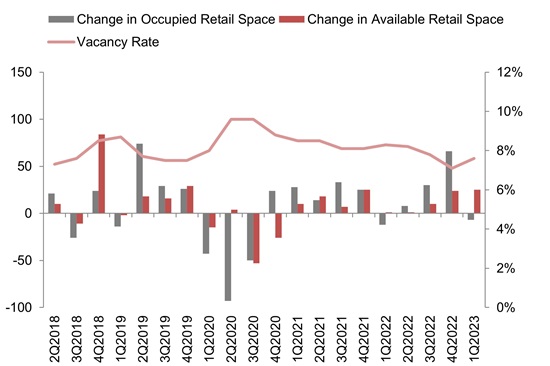
The amount of occupied retail space decreased by 7,000 sq m (nett) in 1st Quarter 2023, compared with the increase of 66,000 sqm m (nett) in the previous quarter. The stock of retail space increased by 25,000 sq m (nett) in 1st Quarter 2023, compared with the increase of 24,000 sq m (nett) in the previous quarter. As a result, the island-wide vacancy rate of retail space increased to 7.6% as at the end of 1st Quarter 2023, from 7.1% as at the end of the previous quarter (see Annexes A-5 [PDF, 73 KB] & E-1 [PDF, 59 KB]).
Stock and vacancy of retail space
URA’S REAL ESTATE INFORMATION SERVICE
More detailed information on the price and rental indices, supply in the pipeline, stock and vacancy rates of the various property sectors can be found in the Real Estate Information System (REALIS), an online database of URA.
More information on REALIS can be found at https://eservice.ura.gov.sg/reis/index.
Table caption
1 | Refers to projects issued with a Temporary Occupation Permit (TOP) or a Certificate of Statutory Completion (CSC), whichever is earlier, in the quarter. |
2 | The prices of private residential properties are not uniform and vary from project to project. Home-buyers can view more detailed information on transactions of private residential properties at: https://eservice.ura.gov.sg/property-market-information/pmiResidentialTransactionSearch. Similar information can also be accessed by users on the go via URA’s iphone/ipad application. The application can be downloaded directly from https://itunes.apple.com/app/property-market-information/id573494340?mt=8. |
3 | Projects in the pipeline are new development or redevelopment projects with planning approvals, i.e. Provisional Permission (PP) or Written Permission (WP). |
4 | More detailed data on supply in the pipeline by market segment, development status and expected year of completion can be found at https://eservice.ura.gov.sg/property-market-information/pmiResidentialPipelinePrivateUnits |
5 | In addition, there is a potential supply of around 8,100 units (including ECs) from Government Land Sales (GLS) sites and awarded en-bloc sale sites that have not been granted planning approval yet, of which a significant proportion could be completed from around 2026 onwards. All in all, there are a total of about 58,300 private housing units in the supply pipeline to cater to the housing needs of the population in the next few years. |
6 | Sites yielding about 4,100 private housing units will be made available via the Confirmed List of the GLS Programme in 1st half of 2023, 17% higher than the 3,500 units made available via the GLS Programme in 2nd half of 2022. This is in addition to the 6,300 private housing units injected via the Confirmed List of the GLS Programmes in 2022. |
7 | ABSD rates for SCs purchasing their second residential property, and third and subsequent residential property were raised from 17% to 20% and 25% to 30% respectively. ABSD rates for PRs purchasing their second residential property, and third and subsequent residential property were raised from 25% to 30% and 30% to 35% respectively. ABSD rates for foreigners and entities/trustees (except housing developers) purchasing any residential property were raised from 30% to 60% and 35% to 65% respectively. Refer to go.gov.sg/ABSD-27Apr for more details. |
SUMMARY OF KEY INFORMATION FOR 1ST QUARTER 2023
Table caption
Annex | Title |
|---|---|
Annex A-1 [PDF, 8 KB] | Comparison of Property Price Index for 4th Quarter 2022 and 1st Quarter 2023 |
Annex A-2 [PDF, 9 KB] | Price Indices of Non-Landed Properties by Market Segment |
Annex A-3 [PDF, 8 KB] | Comparison of Rental Index for 4th Quarter 2022 and 1st Quarter 2023 |
Annex A-4 [PDF, 10 KB] | Rental Indices of Non-Landed Properties by Market Segment |
Annex A-5 [PDF, 73 KB] | Median Rentals and Vacancy of Office and Retail Space |
Annex A-6 [PDF, 16 KB] | Chart of Property Price Index by Type of Property |
Annex A-7 [PDF, 11 KB] | Chart of Residential Property Price Index by Type |
Annex B-1 [PDF, 7 KB] | Number of Unsold Private Residential Units from Projects with Planning Approvals |
Annex B-2 [PDF, 10 KB] | Number of Unsold Private Residential Units from Projects with Planning Approvals by Market Segment |
Annex C-1 [PDF, 10 KB] | Number of Uncompleted Private Residential Units Launched in the Quarter by Market Segment |
Annex C-2 [PDF, 63 KB] | Number of Private Residential Units Sold in the Quarter by Market Segment |
Annex D [PDF, 76 KB] | Number of New Sale, Sub-Sale and Resale Transactions for Private Residential Units by Market Segment |
Annex E-1 [PDF, 59 KB] | Stock & Vacancy and Supply in the Pipeline as at End of 1st Quarter 2023 |
Annex E-2 [PDF, 66 KB] | Supply in the Pipeline by Development Status and Expected Year of Completion as at End of 1st Quarter 2023 |
Annex E-3 [PDF, 30 KB] | Pipeline Supply of Private Residential Units and Executive Condominiums by Expected Year of Completion as at End of 1st Quarter 2023 |
Annex E-4 [PDF, 8 KB] | Number of Private Residential Units and Executive Condominiums Completed in the Quarter |
Annex E-5 [PDF, 28 KB] | Private Residential and Executive Condominium Projects Completed in 2023 |
Annex E-6 [PDF, 9 KB] | Vacancy of Private Residential Units by Market Segment |
Annex F [PDF, 69 KB] | Number of Executive Condominium Units Launched and Sold in the Quarter |