| |
Help
|
Usability and Functions
|
| Enhanced Property Market Information (PMI) eServices at URA-Online |
| What are the minimum system requirements for running the enhanced Property Market Information (PMI) eServices at URA-Online? |
| How do I carry out a search for projects at the enhanced property market information portal? |
| How do I carry out a search for projects using map view at the enhanced property market information portal? |
| Do I need to carry out multiple searches in order to look for information on the same projects from different databases? |
| How can I find out the boundaries of a district from its 2 digit postal code? |
| Why is it taking so long for the webpages to be displayed? |
| How do I go about searching for information on the projects on My Selection Panel after I have clicked on the “GO” button? |
| How do I interpret the data in the “Private Residential Property Transactions with Caveats Lodged” Database? |
| How do I interpret the data in the “Prices of Units Sold in Private Residential Properties” Database? |
| How do I interpret the data in the “Rental Information for Private Residential Developments” Database? |
| How do I interpret the data in the “Private Residential Projects in the Pipeline” Database? |
| What are the data available in the “Private Residential Property Transactions with Caveats Lodged” Database? |
| What are the data available in the “Prices of Units Sold in Private Residential Properties” Database? |
| What are the data available in the “Rental information for Private Residential Developments” Database? |
| What are the data available in the “Private Residential Projects in the Pipeline” Database? |
| What I have to do in order to plot graphs at the various databases at the Property Market Information (PMI) eServices? |
| Will I be able to view all the data or graphs on my selected projects under one single view? |
| Where can I download all the data that I have selected? |
| Where can I print out the results from my information search? |
| What do the “Add Favourite” and “View Favourite” functions offer at the Property Market Information (PMI) eServices? |
| How do I convert per square feet to per square meter? |
| Where can I find monthly updated information on private residential projects with launches, number of units sold and sale prices ($psf) at the Property Market Information (PMI) eServices? |
Where can I find statistics on the pipeline supply of private residential units by market segment, development status and expected year of completion at the Property Market Information (PMI) eServices?
|
 |
| |
|
Enhanced Property Market Information (PMI) eServices at URA-Online
As part of our efforts to continually provide better service, URA has revamped the eServices on property market information by implementing a new system that is more customer - friendly and easy to use. As a user of our new eServices, you will now be able to conveniently carry out a single search to find out information on private residential properties such as transacted prices, units launched and sold, rentals and pipeline supply. You will also be able to compare property market information across different databases and time periods.
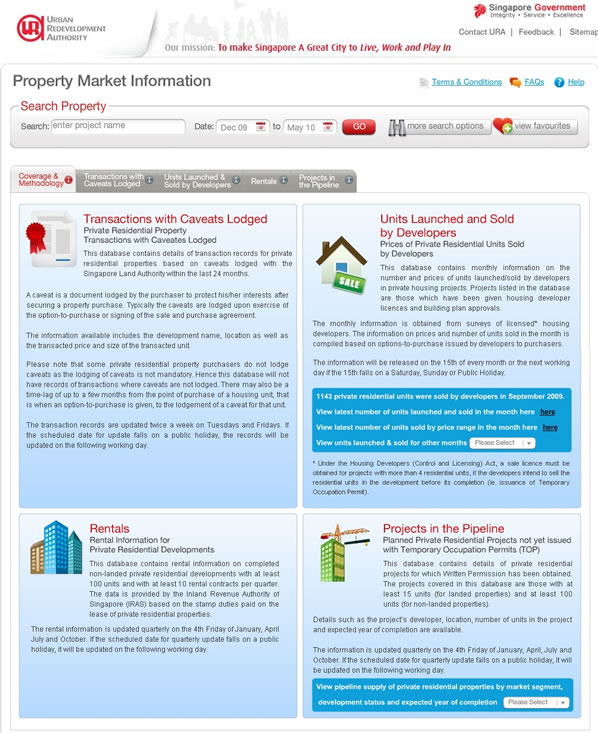
The look and feel of the enhanced property market information (PMI) eServices portal homepage is shown in Screen Shot 1.
The 4 databases in the enhanced property market information eServies portal provide information on:
1) Private Residential Property Transactions with Caveats Lodged;
2) Prices of Units Sold in Private Residential Properties;
3) Rental Information for Private Residential Developments; and
4) Private Residential Projects in the Pipeline.
The coverage and methodology for compiling data in the 4 databases are described here.
Screen Shot 1
|
|
| |
|
What are the minimum system requirements for running the enhanced Property Market Information (PMI) eServices at URA-Online?
To run the enhanced Property Market Information eServices with interactive graphic display, your computer must have the following minimum requirements:
- Windows or Mac Operating System
- 512 MB of RAM
- Flash Player version 9.0.124 & above
Please click http://get.adobe.com/flashplayer/ to download flash player.
|
|
| |
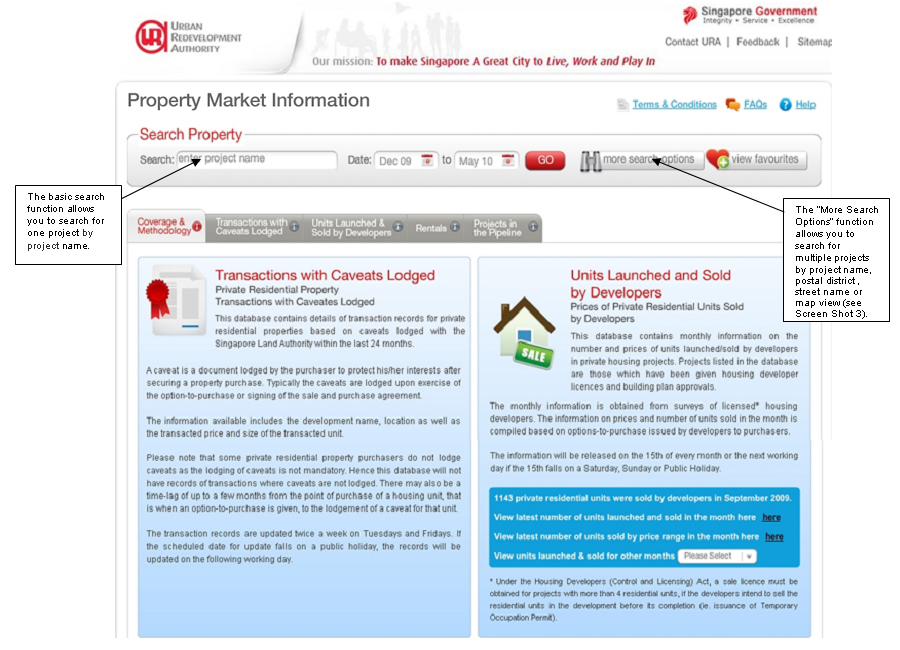
How do I carry out a search for projects at the enhanced property market information portal?
There are 2 search options available at the enhanced property market information portal (see Screen Shot 2 below).
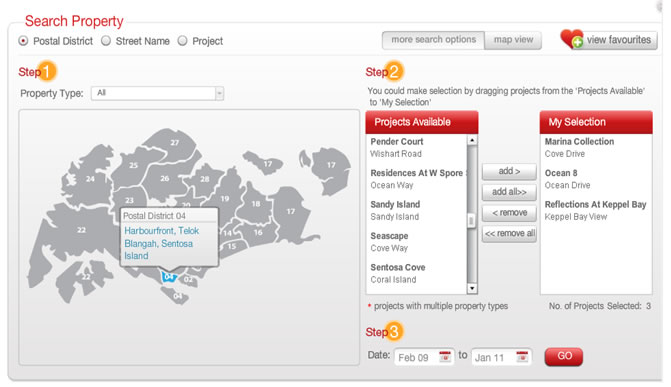
The basic search function allows you to search for a single project by project name. The “More Search Options” function will enable you to search for information on multiple projects based on 4 different searching methods with the help of dropdown lists.
The 4 project searching methods are by project name, 2 digit postal code, street name and map view. By using the 4 project searching methods, you can further refine your search by property type, i.e. landed properties, non-landed properties, or Executive Condominiums. You can also select your projects based on a combination of the above 4 mentioned searching methods concurrently.
Projects which met your selection criteria will appear in the Projects Available Panel. You can then use the “add >” button to move any projects from the Projects Available Panel to My Selection Panel (see Screen Shot 3). You can also use the drag and drop method to drag projects from the Projects Available Panel to My Selection Panel.
Once you have added projects in My Selection Panel, you will need to specify the period from which your search is based on and then click on the “GO” button to display results in the databases.
Screen Shot 2
Screen Shot 3

|
|
|
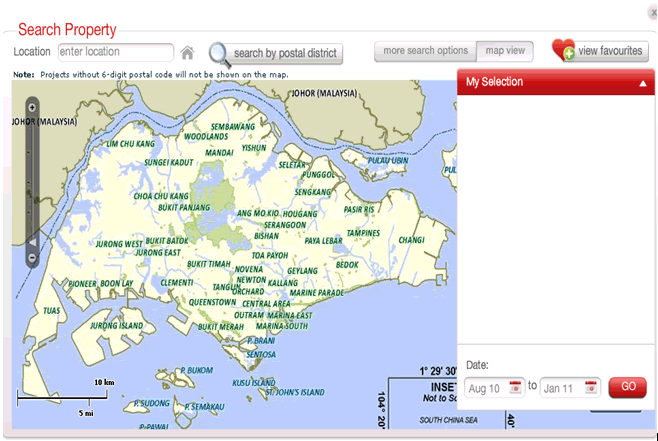
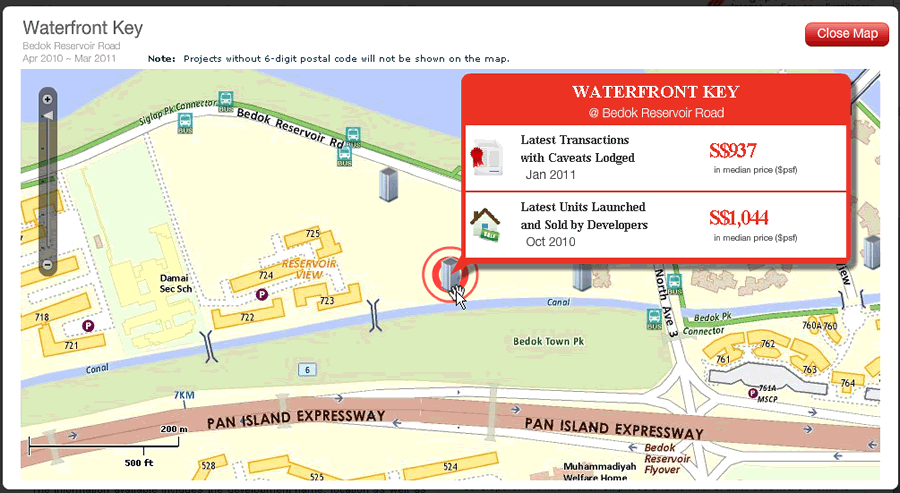
How do I carry out a search for projects using map view at the enhanced property market information portal?
At the map view portion (see Screen Shot 4), you can search for your projects based on location or 2 digit postal districts. When you choose to search by postal district, you will be able to select from a drop down list of 28 postal districts. You can also search your projects based on location by entering project name, street name, address or 6 digit postal codes. Alternatively, you can search with the Singapore map by placing your cursor over the building icon and the latest information (if any) on transaction prices with caveats lodged, prices of units sold by developers or rentals for the selected project will be shown (see Screen Shot 5). When you click on the project icon, the project will be selected and appear in the My Selection Box.
Screen Shot 4
Screen Shot 5

|
|
|
Do I need to carry out multiple searches in order to look for information on the same projects from different databases?
No, you will not need to carry out multiple searches to search for information on the same projects across different databases. The search function at the property market information portal is designed to be a common search function. You just need to carry out one single search and the relevant results will be displayed at the 4 databases if data on the selected projects are available.
|
|
| |
How can I find out the boundaries of a district from its 2 digit postal code?
There is a Singapore map showing the boundaries of the various areas by postal districts (see Screen Shot 6). When you place your cursor over a particular postal district, a text describing the general location of that postal district will appear. This function is useful in letting you know the general location of specific areas should you decide to search for residential projects based on their postal districts.
Screen Shot 6
The 28 postal districts and their corresponding general locations are shown below:
Postal District |
Postal Sector
(1st 2 digit of 6 digit postal codes) |
General Location |
01 |
01,02,03,04,05,06 |
Cecil, Marina, People’s Park, Raffles Place |
02 |
07,08 |
Anson, Tanjong Pagar |
03 |
14,15,16 |
Queenstown, Tiong Bahru |
04 |
09,10 |
Harbourfront,Telok Blangah, Sentosa Island |
05 |
11,12,13 |
Clementi New Town, Hong Leong Garden, Pasir Panjang |
06 |
17 |
Beach Road (part), High Street |
07 |
18,19 |
Golden Mile, Middle Road |
08 |
20,21 |
Little India |
09 |
22,23 |
Cairnhill, Orchard, River Valley |
10 |
24,25,26,27 |
Ardmore, Bukit Timah, Holland Road, Tanglin |
11 |
28,29,30 |
Novena, Thomson, Watten Estate |
12 |
31,32,33 |
Balestier, Serangoon, Toa Payoh |
13 |
34,35,36,37 |
Macpherson, Braddell |
14 |
38,39,40,41 |
Geylang, Eunos |
15 |
42,43,44,45 |
Katong, Joo Chiat, Amber Road |
16 |
46,47,48 |
Upper East Coast, Bedok, Eastwood, Kew Drive |
17 |
49,50,81 |
Loyang, Changi |
18 |
51,52 |
Tampines, Pasir Ris |
19 |
53,54,55,82 |
Serangoon Garden, Hougang, Punggol |
20 |
56,57 |
Bishan, Ang Mo Kio |
21 |
58,59 |
Upper Bukit Timah, Clementi Park, Ulu Pandan |
22 |
60,61,62,63,64 |
Jurong, Jurong Island |
23 |
65,66,67,68 |
Hillview, Dairy Farm, Bukit Panjang, Choa Chu Kang |
24 |
69,70,71 |
Lim Chu Kang, Tengah |
25 |
72,73 |
Kranji, Woodgrove |
26 |
77,78 |
Upper Thomson, Springleaf |
27 |
75,76 |
Yishun, Sembawang |
28 |
79,80 |
Seletar |
|
|
| |
Why is it taking so long for the webpages to be displayed?
The URA website is designed such that the initial loading time of each page should be less than 10 seconds for users with broadband access and a Pentium III computer. Subsequently, the loading time per page should be less than 5 seconds.
The loading time of webpages also depends on certain external factors which are beyond URA's control. These include the bandwidth allocated to your estate by your internet service provider, the number of people surfing the Internet at the same time, the type of service you subscribed to, as well as the configuration of your personal computer.
|
|
| |
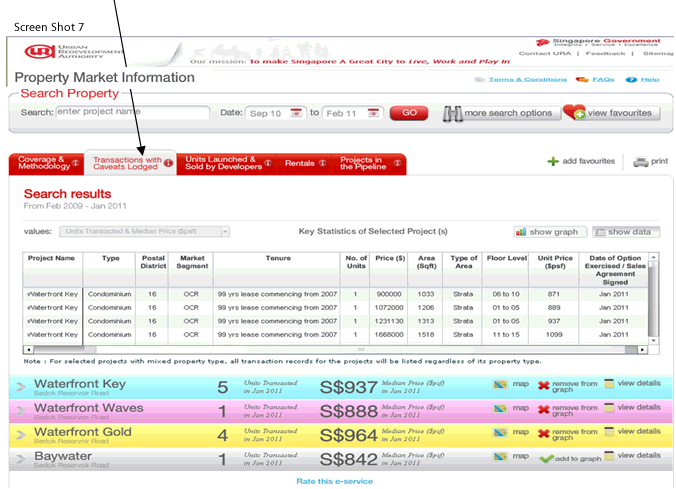
How do I go about searching for information on the projects on My Selection Panel after I have clicked on the “GO” button?
There are 4 databases for you to view the results:
- “Private Residential Property Transactions with Caveats Lodged” Database,
- “Prices of Units Sold in Private Residential Properties” Database,
- “Rental Information for Private Residential Developments” Database and
- "Private Residential Projects in the Pipeline” Database.
Depending on your preferred project selection criteria, each database can be accessed by clicking on the respective tab that reflects its name (see Screen Shot 7 below).
|
|
| |
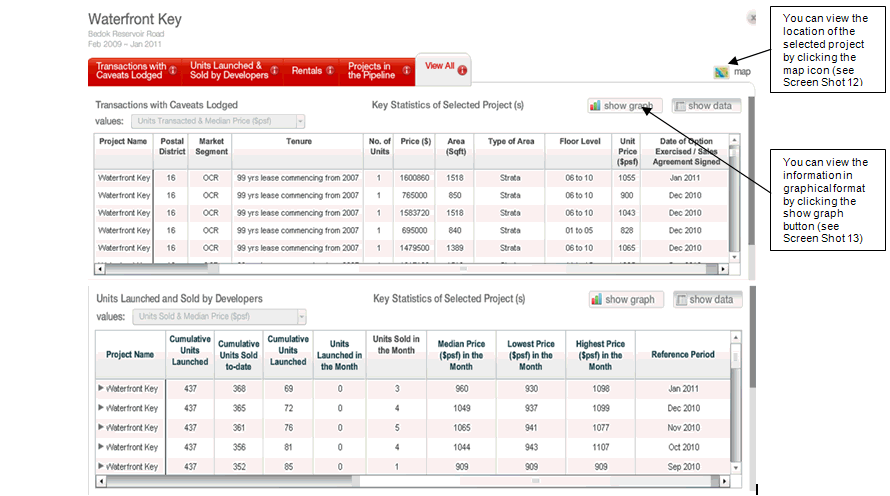
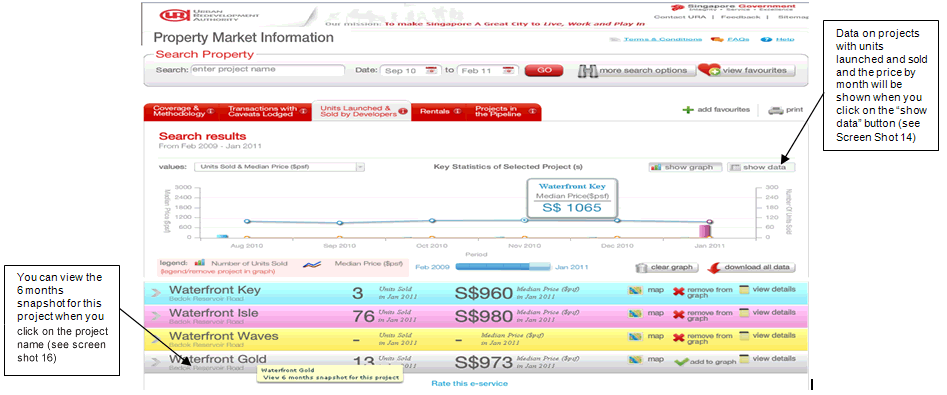
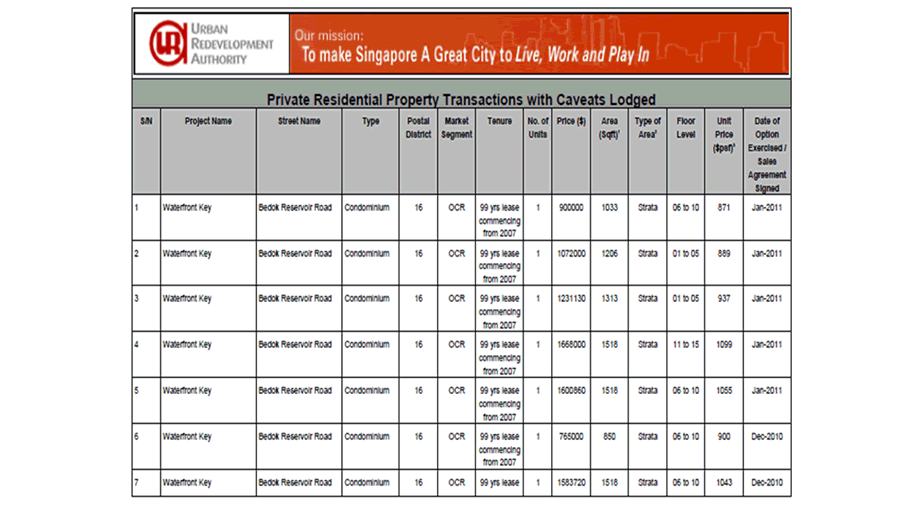
How do I interpret the data in the “Private Residential Property Transactions with Caveats Lodged” Database?
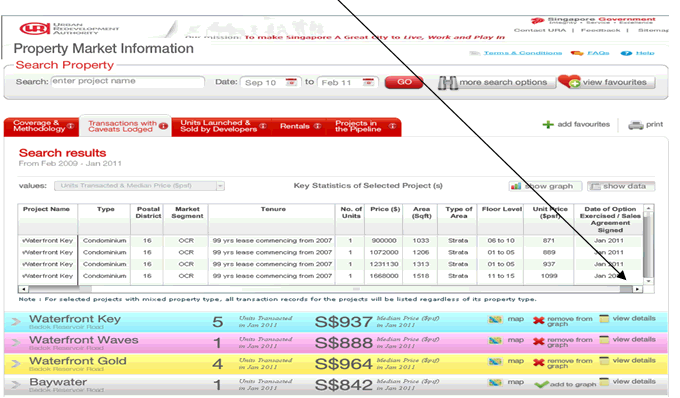
Once you enter the result pages of the “Private Residential Property Transactions with Caveats Lodged” Database, you will be able to view a listing of your selected projects with caveats lodged (see Screen Shot 8). You can scroll horizontally to view (refer to arrow pointed) all data fields available in the listing.
Screen Shot 8
There are two buttons - “show graph” and “show data” - at the top of the listing. You can toggle between them to view the information in graphical or data format. When you activate the “show graph” button, the graphs for the selected projects will be displayed (see Screen Shot 9).
Screen Shot 9
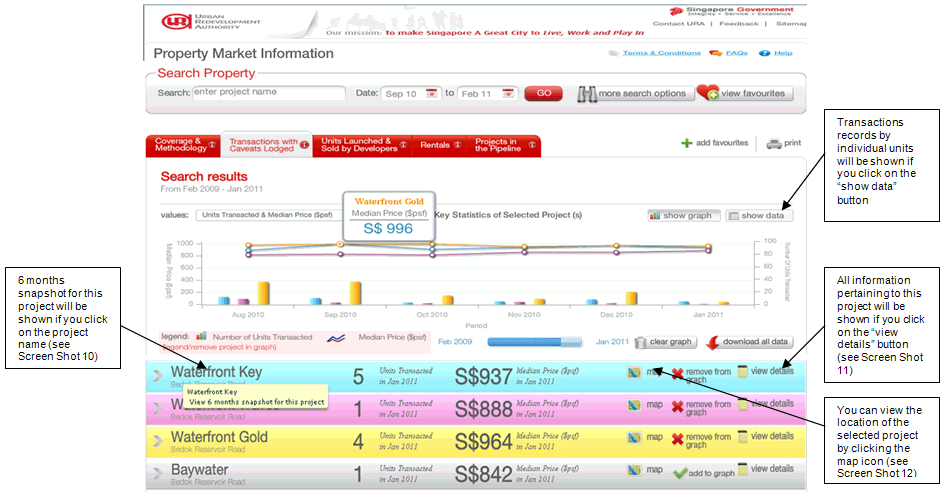
You will be able to see two sets of results being displayed. The top portion is the graph area and the lower portion displays the project listing with caveats lodged.
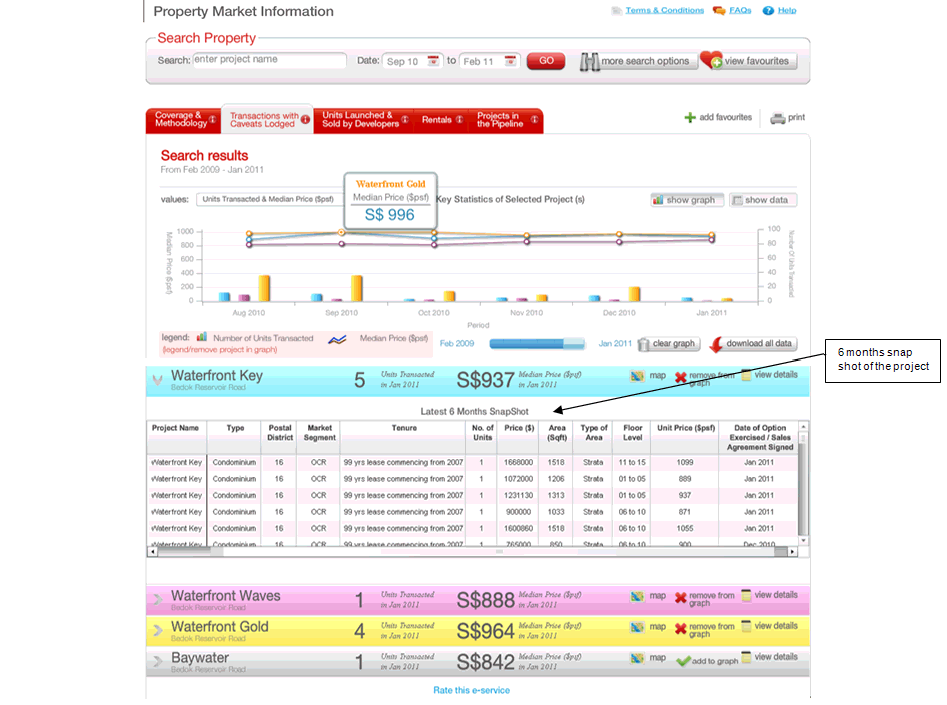
The graphical information enables you to compare key statistics such as number of transactions and prices ($psf) of private residential projects over a certain time period. You will be able to view information on up to 10 projects at one time. By default, the graph area will show bar charts and line charts for 3 projects. The line chart shows the median price ($psf) of that project by month and the bar chart shows number of units transacted with caveats lodged by month.
Information on all projects with caveats lodged based on your selection criteria will be presented below the graph area. This includes key data such as project name, location and median price ($psf). There is a “view details” button at the end of each project listing. All information pertaining to this project (if any) such as transaction prices, units launched & sold, rentals and pipeline supply details will be displayed if you click on the “view details” button. (see Screen Shot 11).
Screen Shot 10
Screen Shot 11
Screen Shot 12
Screen Shot 13
|
|
| |
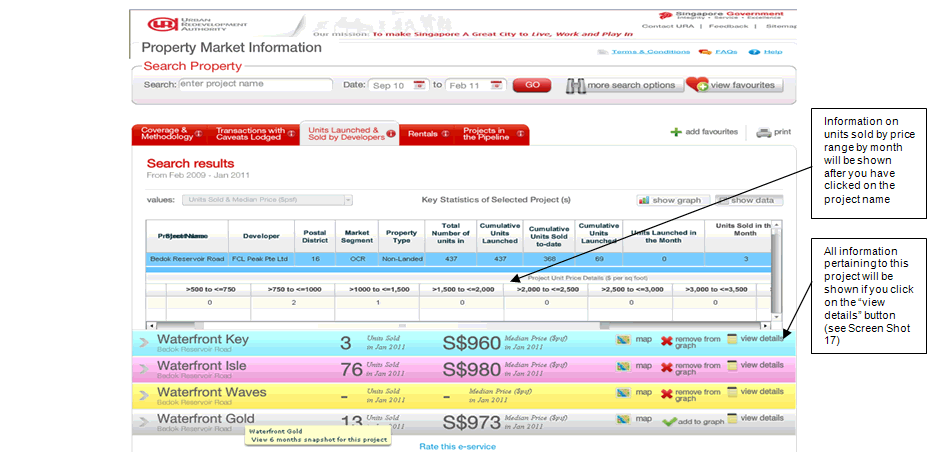
How do I interpret the data in the “Prices of Units Sold in Private Residential Properties” Database?
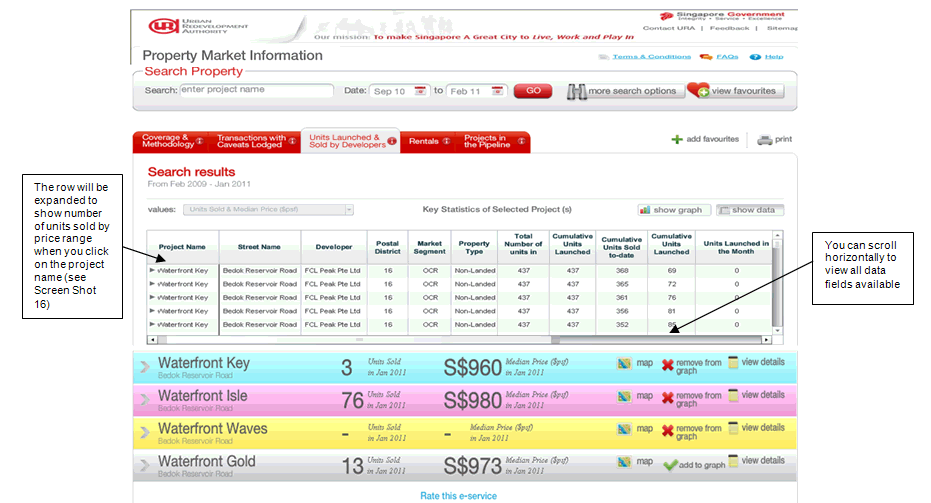
Once you enter the result pages of the “Prices of Units Sold in Private Residential Properties” Database, you will be able to view a listing of your selected projects with units sold by developers (see Screen Shot 14). You can scroll horizontally to view all data fields available in the listing including number of units sold and number of units launched in the month. When you click on the project name, the row will be expanded to show the number of units sold by price range.
Screenshot 14
There are two buttons - “show graph” and “show data” - at the top of the listing. You can toggle between them to view the information in graphical or data format. When you activate the “show graph” button, the graphs for the selected projects will be displayed (see Screen Shot 15).
Screenshot 15
You will be able to see two sets of results being displayed. The top portion is the graph area and the lower portion displays the project listing with units sold by developer..
The graph area is to enable you to compare key statistics such as units sold and median price ($psf) for private residential projects of your choice over a certain time period. You will be able to view information of up to 10 projects at any time. By default, the graph area will show bar charts and line charts for 3 projects. The line chart shows the median price ($psf) of project sold by developer by month and the bar chart shows number of units sold with option given by developers by month.
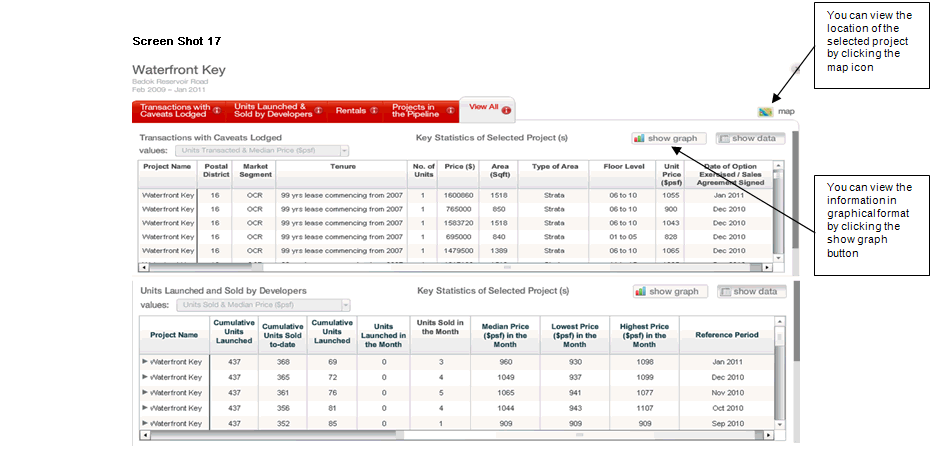
Information on all projects with units sold by developers based on your selection criteria will be shown below the graph area. This includes key data such as the project name, location, units launched, number of units sold and median price ($psf) of units sold in the latest month. There is a “view details” button at the end of each project. Once you click on the “view details” button for a project, all information pertaining to this project (if any) such as units launched & sold, transaction prices, rentals and pipeline supply details will be displayed (see Screen Shot 17).
Screen Shot 16
|
|
| |
|
How do I interpret the data in the “Rental Information for Private Residential Developments” Database?
Once you enter the result pages of the “Rental Information for Private Residential Development” Database, you will be able to view a listing with rental information of selected non-landed private residential properties (see Screen Shot 18).
Screen Shot 18
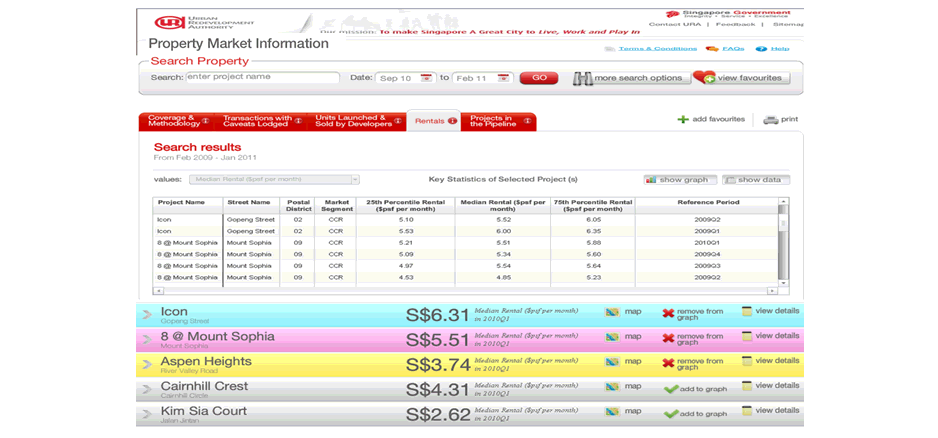
There are two buttons - “show graph” and “show data” - at the top of the listing. You can toggle between them to view the information in graphical or data format. When you activate the “show graph” button, the graphs for the selected projects will be displayed (see Screen Shot 19). When you click on the “show data” button, data on median rental ($psf), 25th percentile rental ($psf) and 75th percentile rental ($psf) per month by quarter for your selected projects will be displayed (see Screen Shot 18).
Screen Shot 19
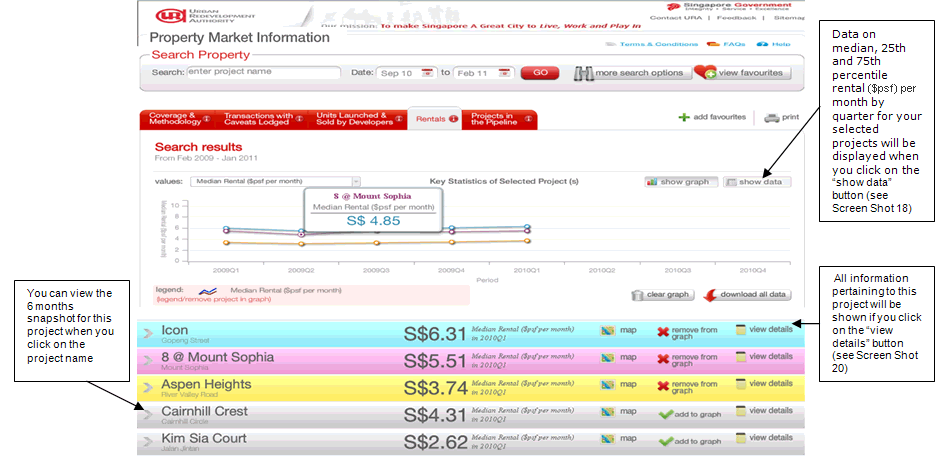
You will be able to see two sets of results being displayed. The top portion is the graph area and the lower portion displays the project listing with rental information of non-landed private residential properties.
The graph area is to enable you to compare key statistics such as median rental ($psf) per month for non landed private residential projects of your choice over a certain time period. You will be able to view information of up to 10 projects at any time. By default, the graph area will show one line chart for each project. The line chart shows the median rental ($psf) per month of non landed properties by quarter. There are two buttons - “show graph” and “show data” - at the graph area. You can toggle between them to view the information in graphical or data format.
All projects with information on median rental ($psf) per month based on your selection criteria will be listed below the graph area. Each project will display key information such as project name, location, median rental ($psf) per month for the latest quarter. There is a “view details” button at the end of each project listing. Once you click on the “view details” button for a project, all information pertaining to this project (if any) such as rental, transaction prices, units launched & sold and pipeline details will be displayed (see Screen Shot 20).
Screen Shot 20
Screen Shot 21
|
|
| |
|
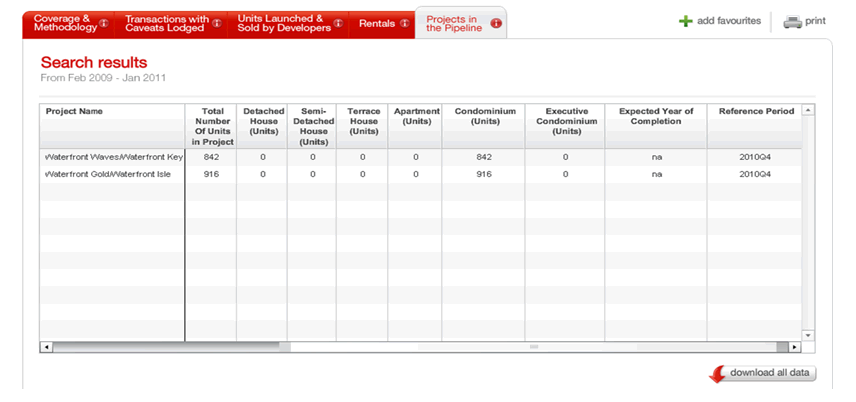
How do I interpret the data in the “Private Residential Projects in the Pipeline” Database?
Once you enter the result pages for the “Private Residential Projects in the Pipeline” Database, you will be able to see major project listing for uncompleted private residential properties in the pipeline for the latest quarter (see Screen Shot 22). This database contains uncompleted private residential properties which are granted Written Permission (WP) and landed properties with at least 15 units and non-landed properties with at least 100 units.
The major projects listed in this database will be based on your selection criteria. Each project will display key information such as project name, location, number of private residential units and expected year of completion for the latest quarter.
Screen Shot 22
|
|
| |
What are the data available in the “Private Residential Property Transactions with Caveats Lodged” Database?
This database contains details of transaction records for private residential properties and Executive Condominiums based on caveats lodged with the Singapore Land Authority (SLA) within the last 24 months. The data items available in this database are:
a) Project Name
b) Street Name
c) Property Type
d) 2-Digits Postal District
e) Market Segment
f) Land Tenure
g) Number of Units
h) Price ($)
i) Land/Floor Area (Sqft)
j) Type of Area (Land or Strata)
k) Floor Level (in floor range of 5)
l) Unit Price ($psf)
m) Date of Option Exercised/Sales Agreement Signed (by Month and Year)
All data items can be sorted to facilitate easier information searches.
|
|
| |
What are the data available in the “Prices of Units Sold in Private Residential Properties” Database?
This database contains monthly information on the number and prices of units sold by developers in uncompleted and completed private residential properties and Executive Condominiums. Projects listed in the database are those which have been given housing developer licences and building plan approvals. The monthly information is obtained from surveys of licensed housing developers. The data items available in this database are:
a) Project Name
b) Street Name
c) Developer
d) 2-Digits Postal District
e) Market Segment
f) Property Type
g) Total Number of Units in Project
h) Cumulative Units Launched To-Date
i) Cumulative Units Sold To-Date
j) Cumulative Units Launched but Unsold
k) Units Launched in the Month
l) Units Sold in the Month
m) Median Price ($psf) in the Month
n) Lowest Price ($psf) in the Month
o) Highest Price ($psf) in the Month
p) Number of Units Sold in the Month by Price Range ($psf)
q) Reference Period (by Month and Year)
All data items can be sorted to facilitate easier information searches.
|
|
| |
What are the data available in the “Rental information for private residential Developments” Database?
This database contains rental information on completed non-landed private residential developments with at least 100 units and with a least 10 rental contracts per quarter. The data is provided by the Inland Revenue Authority of Singapore (IRAS). The data items available in this database are:
a) Project Name
b) Street Name
c) 2-Digits Postal District
d) Market Segment
e) 25th Percentile Rental ($psf per month)
f) Median Rental ($psf per month)
g) 75th Percentile Rental ($ psf per month)
h) Reference Period (by Quarter and Year)
All data items can be sorted to facilitate easier information searches.
|
|
| |
What are the data available in the “Private Residential Projects in the Pipeline” Database?
This database contains details of major private residential projects in the pipeline for which Written Permission has been obtained, ie. those with at least 15 units (for landed properties) and at least 100 units (for non-landed properties). The data items available in this database are:
a) Project Name
b) Street Name
c) Developer
d) 2-Digits Postal District
e) Market Segment
f) Total Number of Units in Project
g) Number of Units by Type
h) Expected Year of Completion
i) Reference Period (by Quarter and Year)
All data items can be sorted to facilitate easier information searches
|
|
| |
|
What I have to do in order to plot graphs at the various databases at the Property Market Information (PMI) eServices?
Graph functions are available in three databases: the “Private Residential Property Transactions with Caveats Lodged” Database, “Prices of Units Sold in Private Residential Properties” Database, and “Rental Information for Private Residential Developments” Database. After you have carried out your search for projects, the search results will be shown. By default, you will view the results for the private residential property transactions with caveats lodged first. You can click on the tab on top of each database to view the respective results based on your project selection criteria.
There are two buttons - “show graph” and “show data” - at the top of the listing in each database. You can toggle between them to view the information in graphical or data format. When you activate the “show graph” button, the graphs for the selected projects will be displayed (see Screen Shot 23).
Screen Shot 23
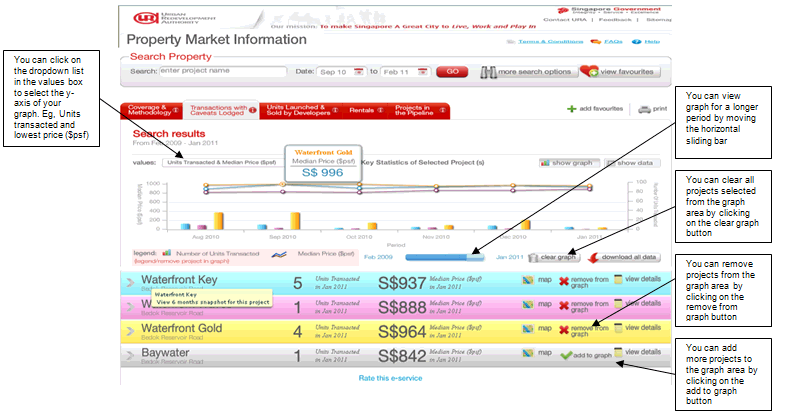
The graph area for the database will display key statistics on the first 3 projects you have selected. You can add more projects to the graph area by clicking the “add to graph” button located at the end of each project listed (see Screen Shot 23). The graph area can accommodate up to a maximum of 10 projects to allow meaningful comparison of key statistics for the selected projects.
Alternatively, you can plot graphs for projects by first clearing the graph area. To do so, click the “clear graph” button located the bottom of the graph area. After you have cleared the graph, you can then proceed to add projects of your choice to the graph area. To facilitate ease of comparison of projects, the project moved to the graph area will be assigned the same colour for the legend (bar and line chart) as well as for the project listing at the lower portion of the database.
The graph area will enable you to view graphs over a specified period (i.e. 6 months for the “Private Residential Property Transactions with Caveats Lodged” Database and “Prices of Units Sold in Private Residential Properties” Database and 6 quarters for the “Rental Information for Private Residential Developments” Database). If you want to view graphs of your selected projects beyond the specified period, you will need to move the horizontal sliding bar located at the bottom of the graph area.
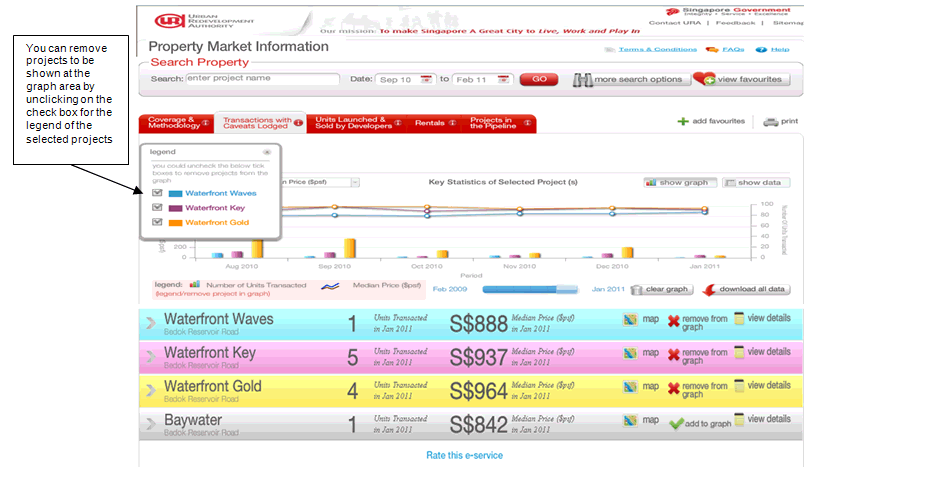
To remove selected projects from the graph area, you can go to the lower portion of the database and simply click the “remove from graph” button for that selected project you wish to remove from the graph area. Alternatively, you can add or remove projects to be shown at the graph area by clicking or unclicking the check box for the legend for the selected projects (see Screen Shot 24).
Screen Shot 24
|
|
| |
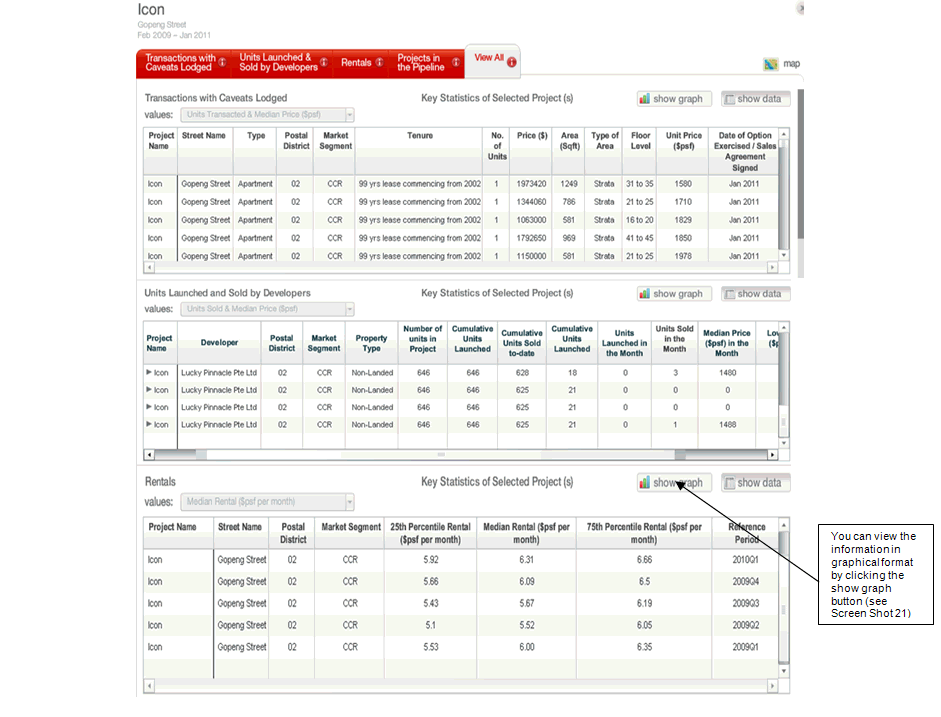
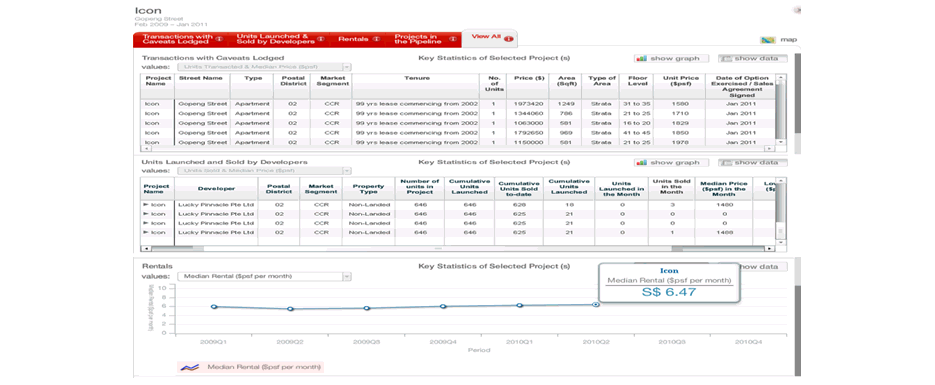
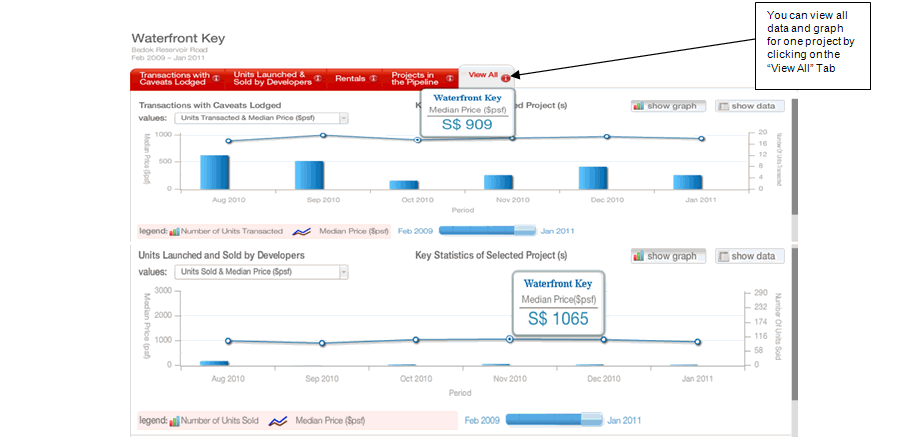
Will I be able to view all the data or graphs on my selected projects under one single view?
The single view option only allows you to view data on a single project. When you click the “view details” button for any project listed in the database, more details about this project will be shown. When single project is selected, a “view all” tab will appear at the top of the database. The “view all” tab allows you to view all data and graph pertaining to one project under one single view (see Screen Shot 25). At the graph area, you can toggle between the “show data” and “show graph” views.
Screen Shot 25
|
|
| |
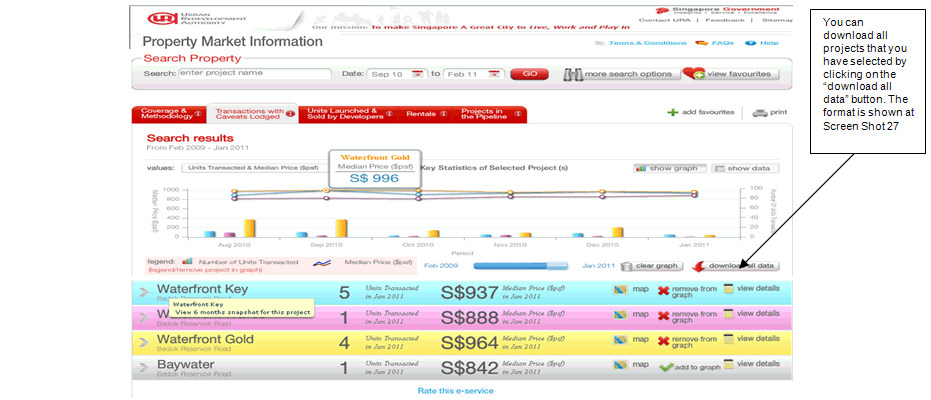
Where can I download all the data that I have selected?
There is a download function available for you to download all data that you have selected at all of the 4 databases (see Screen Shot 26). All data are downloaded in PDF format (see Screen Shot 26).
Screen Shot 26
Screen Shot 27
|
|
| |
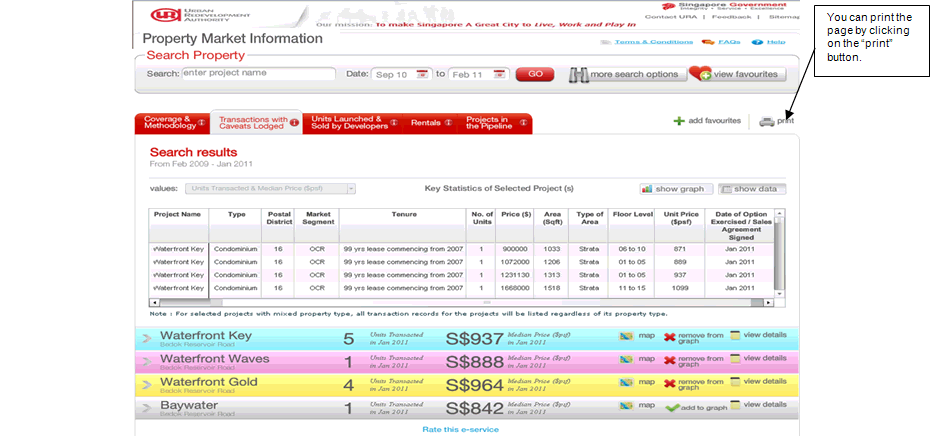
Where can I print out the results from my information search?
There is a user friendly print function available for you to print the graph and project listings as shown on the screen in the databases (see Screen Shot 28).
Screen Shot 28
|
|
| |
|
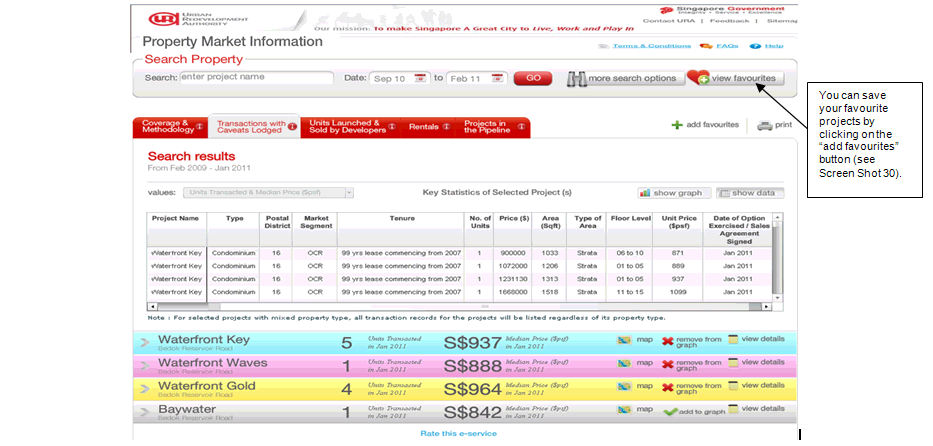
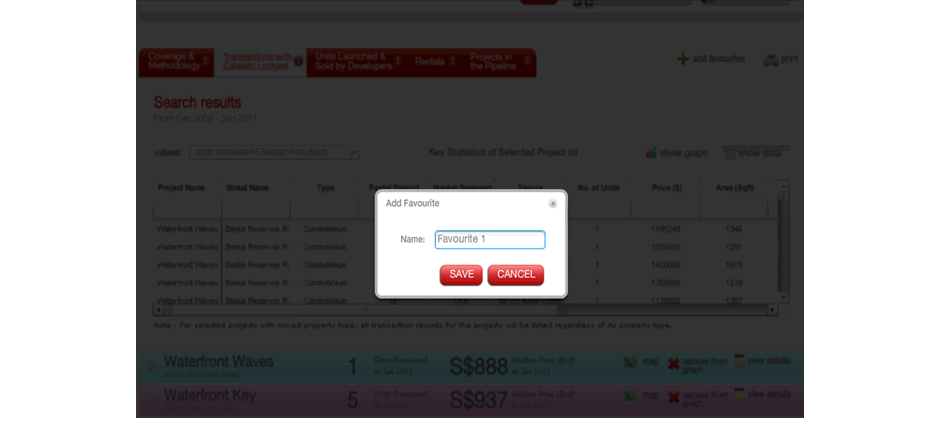
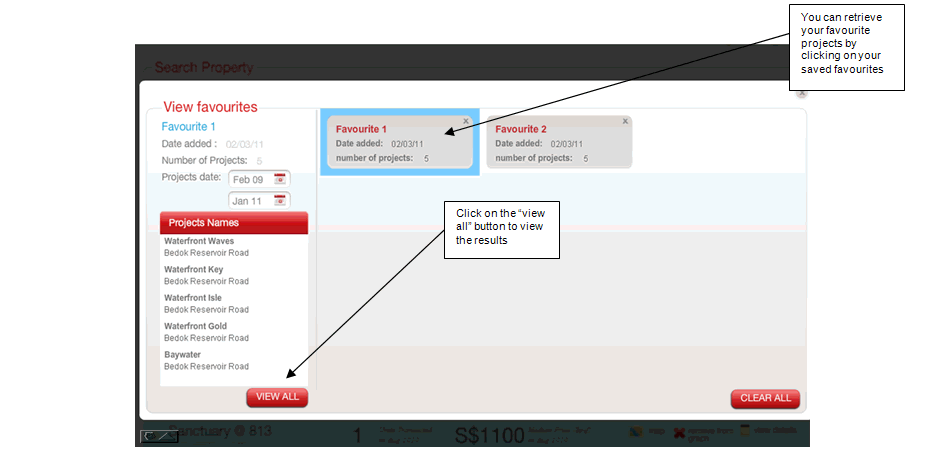
What do the “Add Favourite” and “View Favourite” functions offer at the Property Market Information (PMI) eServices?
The PMI allows you save a listing of your favourite projects based on those you have selected (see Screen Shot 29 and 30) . The “add to favourites” button is located at the top of every databases. The “view favourites” function allows you to retrieve the projects you have saved to your computer. (see Screen Shot 31).
Screen Shot 29
Screen Shot 30
Screen Shot 31
|
|
| |
|
How can I do a conversion of units from square feet to square metres?
To convert an area from sqft to sqm, multiply the figure by 10.764.
To convert a price from $psf to $psm, divide the figure by 10.764.
|
|
| |
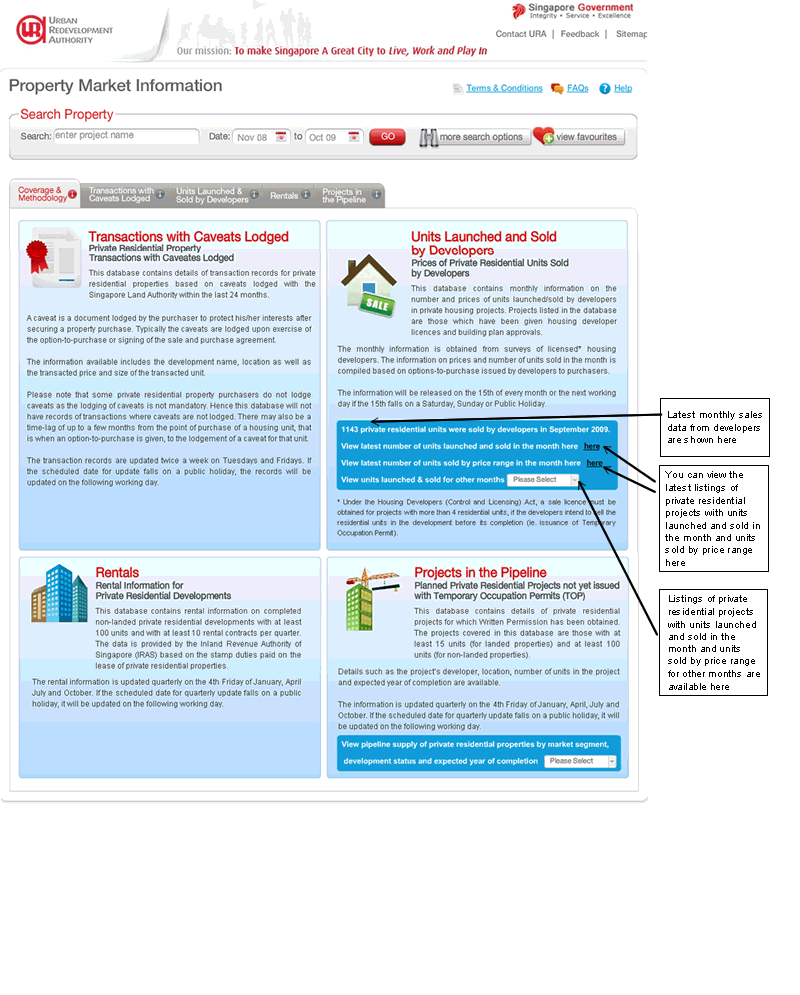
Where can I find monthly listings of private residential projects with launches, units sold and sale price ($psf) at the Property Market Information (PMI) eServices?
This listing can be found at the Property Market Information portal entrance page (see Screen Shot 32). The information is available for the current as well as previous months.
Screen Shot 32
|
|
| |
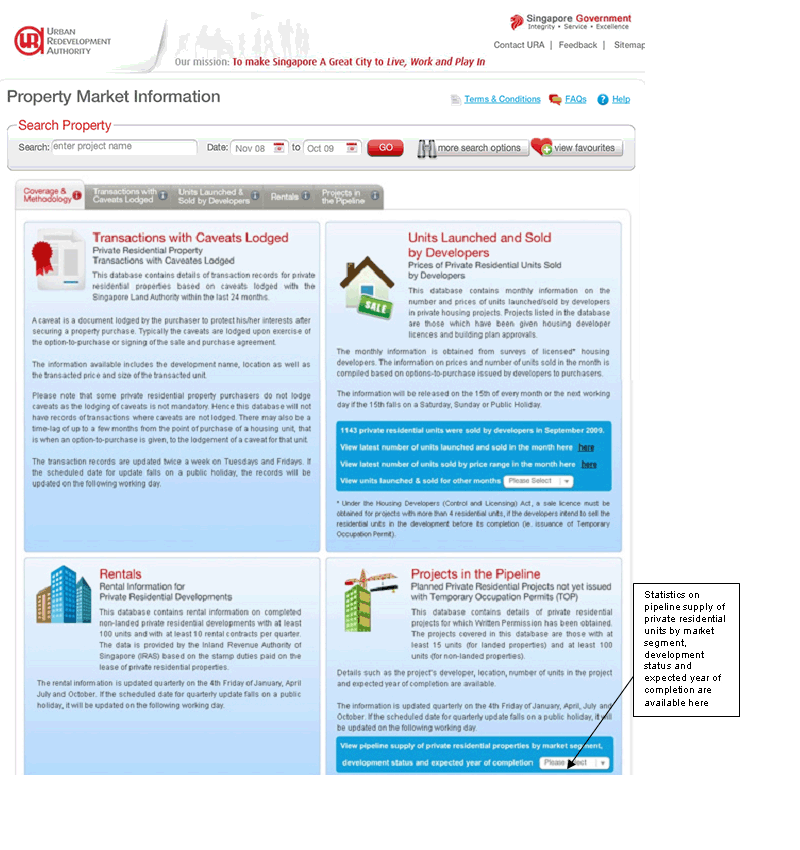
Where can I find statistics on pipeline supply of private residential units by market segment, development status and expected year of completion at the Property Market Information (PMI) eServices?
You can find statistics on pipeline supply of private residential units by market segment, development status and expected year of completion at the Property Market Information portal entrance page (see Screen Shot 33).
Screen Shot 33
|
| |
|
By using this eService, you will be deemed to have read and accepted these Terms and Conditions.
|